
Hi minions:
I haven’t been here since some time ago. there are several circumstances that I’ve been forced to slow down rhythm of my life. Accordingly, I won’t be able to maintain the publication times that I followed before. At least temporarily.
Also, some time ago I wanted to write about what I am going to show today. Even more since I read, in a book focused on Forensic Computing, some time ago and literally: «Timelines and other tools of analysis.» As if the fact of making a timeline on an evidence was something secondary, dispensable, irrelevant, unimportant.
For obvious reasons I will not say the title of the book, because it also has its strengths. But I will say that It did not dedicate more than one paragraph to this topic.
From my humble view, a timeline should be carried out, yes or yes. It is carried out on some artifact of the System, or on the whole forensic image. I consider it basic because it will always help me understand what happened in a System. Whether I know what I’m looking for or not. And I think it will always be a good reference to consult.
But, what is a timeline? A timeline consists in the realization of a list of events, establishing a chronological order. It’s that simple? Yes and no. But this definition it is enough, at the moment, to know what I want to do: Sort chronologically all activity that a System has suffered.
The timelines are very useful to quickly obtain a list of all the activity of the files. I can get clues about what kind of activity a System has suffered. After all, almost everything contains timestamps, (Registry, Logs, Events, File System, …).
They say that there are not too many tools capable of generating time lines. I would add, ‘of recognized prestige‘, because tools, there are a few. To mention just a few, out of the most common, I will mention RegTime, plugin included at RegRipper, EvtxParse with LogParser, CyberForensics TimeLab, Zeitline, Ex-tip, fte, … There are many tools and projects, some of them really interesting.
On the other hand … whenever ‘I tinkering‘ I ask myself the same question, can I ‘exploit‘ the potential of each of the tools I use? Do I worry about ‘pry‘ with them to discover their limits?
In this case I will show three of them. Perhaps, the three that have more importance for me: The Sleuth Kit, Plaso and AnalyzeMFT.
I can assure you that, since I read those lines, my eagerness to document me about the timelines has been increasing. There have been many readings I have made on this subject, many of them very interesting, and I must confess that I am a bit ‘exquisite’ with what I like to read. I like to read material that is not purely technical but that is complete. That way, I can see for myself that technical part.
On the way I’ve come across a couple of readings that, from now on, I recommend you:
One of them is «Mastering the Super Timeline With log2timeline»
The other one is «Generating computer forensic supertimelines under Linux: A comprehensive guide for Windows-based disk images«. This document also includes a nice script for the generation of timelines, which I invite you to try and that you can download from its site.
Introduction
For the elaboration of this article I have created a forensic image of a virtual hard drive, (.vmdk), of 20GB.
ls -s /home/marcos/Evidences/Windows10x64/

I check the type of file that I am going to deal with. It is appreciated that both the virtual hard disk and the forensic image are the same.
file -s /home/marcos/Evidences/Windows10x64/*

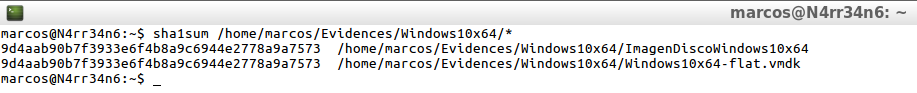
However, as ‘the habit makes the monk’, I calculate its signature hash in SHA1, giving the same result, which indicates that the forensic image has not been altered with respect to the virtual hard disk.
sha1sum /home/marcos/Evidences/Windows10x64/*
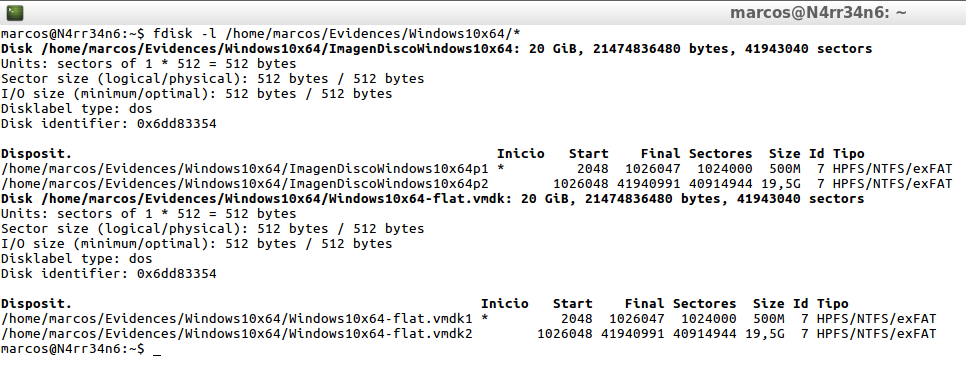
The next thing I do is see what partitions it has, as well as its type, and where each of them starts.
fdisk -l /home/marcos/Evidences/Windows10x64/*
This far, these steps, I believe it is essential that they always repeat themselves. I believe that this is how all analysis should begin.
Before starting, I will tell you that I work with a Lubuntu distribution, (I like to be lightweight), and that it contains, among others, SIFT, (SANS Investigative Forensics Toolkit), and REMnux, so I have installed a good repository of tools, among which are the three of which I will speak today. Let’s start with each of them.
The Sleuth Kit, (TSK)
‘The Sleuth Kit‘ was developed and is maintained by Brian Carrier, author of the book «File System Forensic Analysis«, which he wrote while developing this suite. He is also the creator of ‘Cyber Triage‘, a tool dedicated to the Incident Response, and Vice President of Basis Technology.
As defined by its own Wiki, ‘The Sleuth Kit’ is a digital, open-source forensic framework that contains a collection of command-line tools for analyzing disk images. This framework has a command line interface that uses different modules to analyze disk images.
This framework can work on Linux systems, Windows systems and Mac OS systems, both in its CLI mode and in its GUI mode, through Autopsy for Linux systems or Autopsy for Windows systems.
Instructions for its installation are available on its official GitHub site.
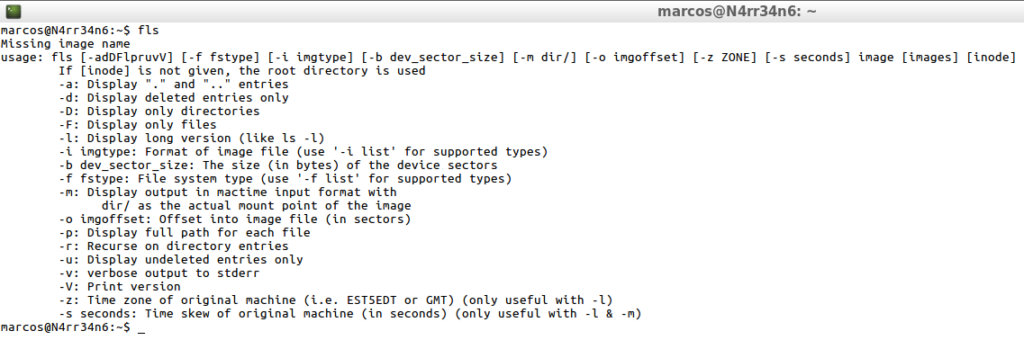
The first of the tools in this Framework is ‘FLS‘, which lists the names of files and directories in a file system. It processes the contents of a given forensic image and shows information about the deleted files.
For a change, the first thing I do is see what help its can offer and know what are the basic instructions for its operation.
fls
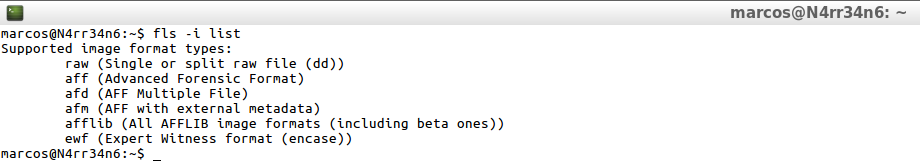
I also tell it to show me what types of forensic image format it supports.
fls -i list
And I also tell it to tell me what kind of file systems he supports.
fls -F list
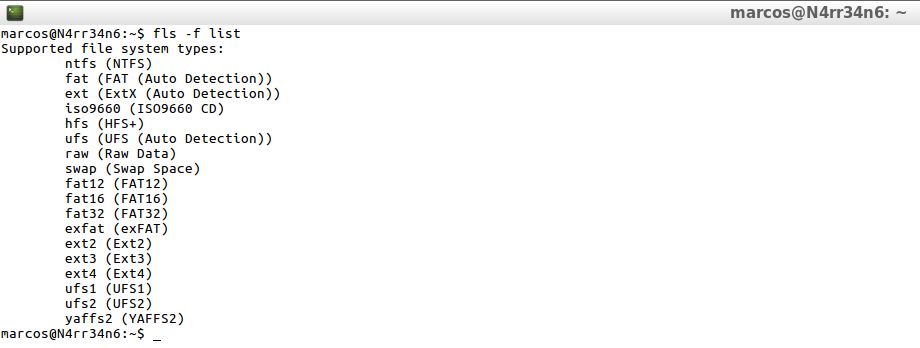
As can be seen, it has some very interesting options and supports the types of forensic image format most used, as well as most types of file systems.
It can be used without a recursive mode, it can be indicated that it only processes deleted files, …
And I can work directly on the Forensic Image, without intermediate files. But it is not the best mode, since its processing takes a while.
fls -o 1026048 -f ntfs -i raw -b 512 /home/marcos/Evidences/Windows10x64/ImagendiscoWindows10x64 | egrep "DT.png"

fls -r -o 1026048 -f ntfs -i raw -b 512 /home/marcos/Evidences/Windows10x64/ImagendiscoWindows10x64 | egrep "DT.png"

fls -rp -o 1026048 -f ntfs -i raw -b 512 /home/marcos/Evidences/Windows10x64/ImagendiscoWindows10x64 | egrep "DT.png"

fls -rpl -o 1026048 -f ntfs -i raw -b 512 /home/marcos/Evidences/Windows10x64/ImagendiscoWindows10x64 | egrep "DT.png"

To make a complete timeline of the forensic image of the System, interest me in using some specific arguments.
fls -rpl -o 1026048 -m / /home/marcos/Evidences/Windows10x64/ImagenDiscoWindows10x64 >> /home/marcos/Evidences/Windows10x64/ImagenDiscoWindows10x64_Bodyfile.txt
![]()
What have I done with this line?
fls – I invoke the tool
-r – I tell it to work in recursive mode
-p – I indicate it showing the complete path of the files
-l – I tell it to show the long version, where it show more details
-o 1026048 – I indicate the start offset of the partition that I want to process, (which I obtained earlier with ‘fdisk -l)’.
-m / – I tell it to show the output in an input format, (‘Bodyfile‘), to process it later with ‘Mactime‘.
>> – I indicate it to, instead of printing the results on the screen, export the result to a file.
It is enough, only, indicate the offset of the beginning of the partition that I want to process, although it could, ‘complicate me?‘, life indicating the rest of the arguments that affect the forensic image,
fls -rpl -o 1026048 -f ntfs -i raw -b 512 -m / /home/marcos/Evidences/Windows10x64/ImagenDiscoWindows10x64 >> /home/marcos/Evidences/Windows10x64/ImagenDiscoWindows10x64_Bodyfile.txt
![]()
That the result will be exactly the same. A text file, with the data of the processed forensic image, called the ‘Body’ file.
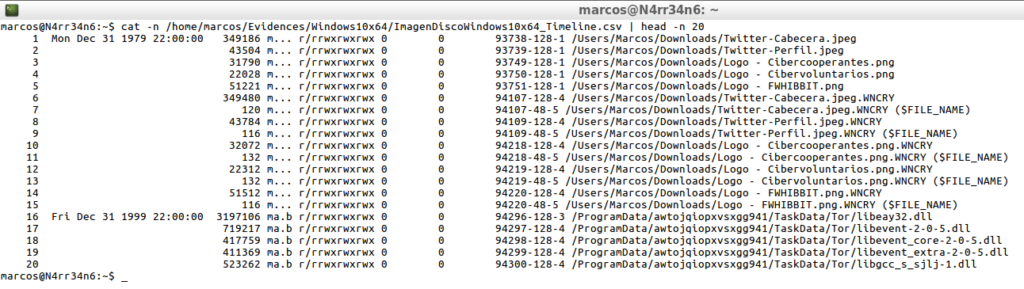
cat -n /home/marcos/Evidences/Windows10x64/ImagenDiscoWindows10x64_Bodyfile.txt | head -n 20

It is an intermediate file used to make easily readable, (readable is already), the timeline, delimited by Pipeline (‘|’), which contains a line for each processed file and presents the following format
MD5|name|inode|mode_as_string|UID|GID|size|atime|mtime|ctime|crtime
To make it easily readable I will use ‘Mactime‘, another of the tools in this framework, which will create a temporary ASCII line, which classifies the data based on its temporary data and prints the result, using the ‘Body’ file that I generated previously with ‘FLS’.
For this, I just need to indicate the argument ‘-b’, followed by that file ‘Body’, and tell it to give me the output to another file ‘.csv’
mactime -b /home/marcos/Evidences/Windows10x64/ImagenDiscoWindows10x64_Bodyfile.txt >> /home/marcos/Evidences/Windows10x64/ImagenDiscoWindows10x64_Timeline.csv
![]()
And, what would be the result of that new ‘.csv’ file? The content of this file will be presented in eight tabulated columns
Date/Time Size Activity Unix User Group inode File Name
cat -n /home/marcos/Evidences/Windows10x64/ImagenDiscoWindows10x64_Timeline.csv | head -n 20
With this I have created a complete timeline of the System. It’s easy, right?
In fact, this is the common way to use this suite. In fact, it’s the one I’ve been seeing in most of the readings I’ve done.
But … there is always some but.
I have a nice ‘.csv’ file that contains a timeline with the activity of the System. But this file in particular, (on a Forensic Image of 20 GB), has a size of more than 80 MB, with about 500,000 lines, one line for each file processed.
What would contain a timeline of a modern hard drive, 500 GB or 1 TB, and also have been active for a long period of time?
Who is the brave one who faces that? I could try to open it with some office application, but it is possible that I would throw an error in which it tell me that the document ‘exceeds the number of lines it can support‘. I could analyze that timeline using only the CLI, but I do not have a date for each line, so I would have to apply parameters of the type ‘egrep -A -B’
To solve this problem of having a date per line, just as I have in the ‘Body’ file, I indicate, in addition to the parameter ‘-b’, the parameter ‘-d’, to tell it to the timeline be delimited by commas.
mactime -d -b /home/marcos/Evidences/Windows10x64/ImagenDiscoWindows10x64_Bodyfile.txt >> /home/marcos/Evidences/Windows10x64/ImagenDiscoWindows10x64_Delimited_Timeline.csv
![]()
And the result would be very different from the previous one.
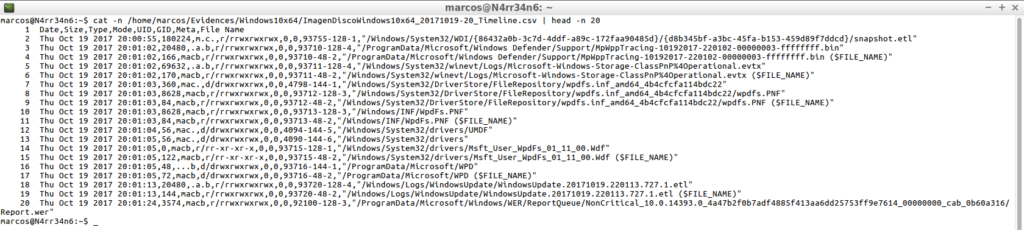
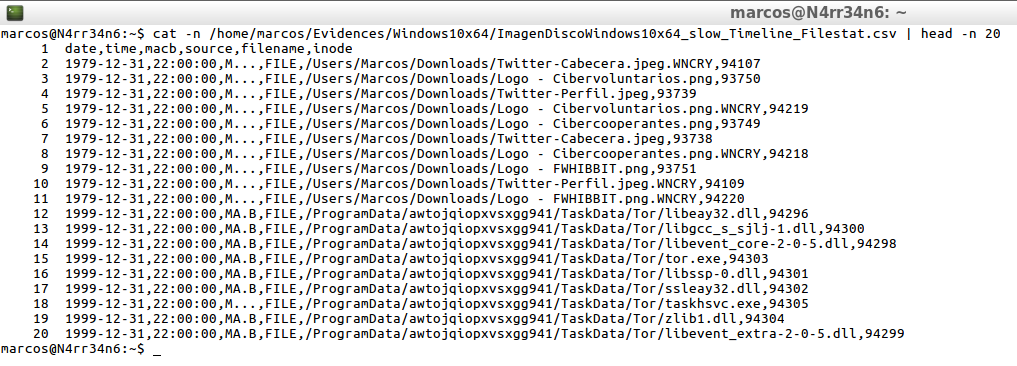
cat -n /home/marcos/Evidences/Windows10x64/ImagenDiscoWindows10x64_Delimited_Timeline.csv | head -n 20
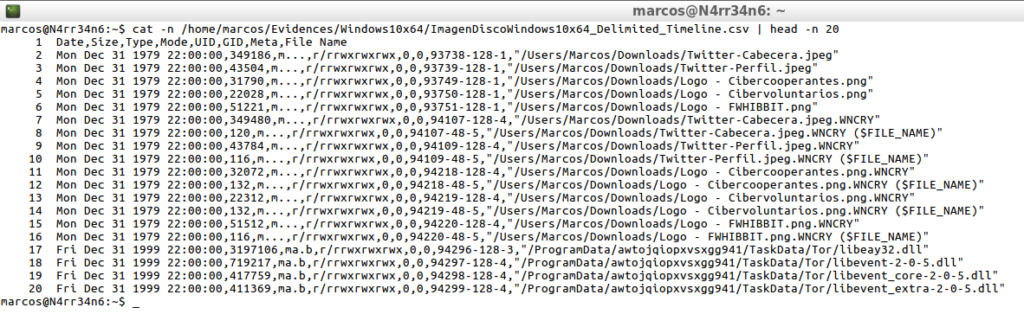
Yes now. I already have a timeline created, well legible, with a line for each file, with its corresponding date. Now I could start working with that timeline in CLI mode.
But I still have the same problem of file size and number of lines.
To solve this problem, this tool also allows filtering by dates, with two interesting options. Allow me to instruct it to process data from a particular date.
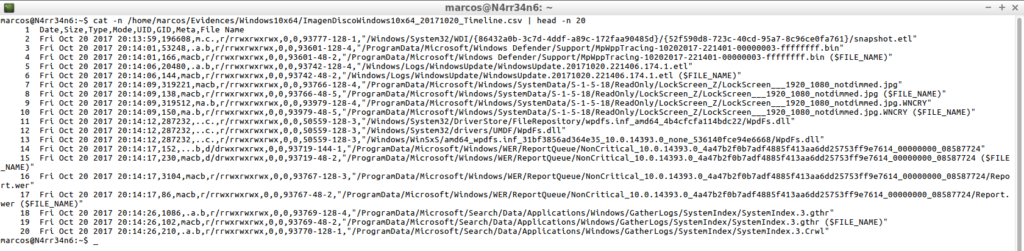
mactime -d -b /home/marcos/Evidences/Windows10x64/ImagenDiscoWindows10x64_Bodyfile.txt 2017-10-20 >> /home/marcos/Evidences/Windows10x64/ImagenDiscoWindows10x64_20171020_Timeline.csv
![]()
So the timeline will start from that date.
cat -n /home/marcos/Evidences/Windows10x64/ImagenDiscoWindows10x64_20171020_Timeline.csv | head -n 20
And it allows me to tell it to work on a range of dates.
mactime -d -b /home/marcos/Evidences/Windows10x64/ImagenDiscoWindows10x64_Bodyfile.txt 2017-10-19 2017-10-20 >> /home/marcos/Evidences/Windows10x64/ImagenDiscoWindows10x64_20171019-20_Timeline.csv
![]()
So it will make the timeline within that range of dates.
cat -n /home/marcos/Evidences/Windows10x64/ImagenDiscoWindows10x64_20171019-20_Timeline.csv | head -n 20
From here, the limit is my imagination. I will always have some information to look for, some date, some name, some type of activity, …
Plaso, (Plaso Langar Að Safna Öllu)
It is often said of ‘Plaso‘ that is a tool capable of making a super-timeline of all things. It is a Python-based backend, capable of extracting timestamps of several types of files, of several artifacts. Its initial objective is to collect all the events of interest, analyze several registry files and forensic artifacts, and add them to a super timeline, but it also supports the creation of specific timelines.
It can work under Windows Systems, under Linux Systems and under Mac OS Systems.
‘Plaso’ is currently maintained by Joachim Metz. It consists of several command line tools.
The main tool on which ‘Plaso‘ works is’ Log2timeline ‘, which is defined as a framework for the creation and analysis of timelines, through an intermediate file, which can be used with other tools, such as’ The Sleuth Kit ‘. ‘Log2timeline’ was developed by Kristinn Gudjonsson, author of the Blog http://blog.kiddaland.net/.
Instructions for its installation are available on its official GitHub site.
I’ll start with that main tool, ‘Log2timeline‘, as always, seeing what options it can offer.
log2timeline.py -h
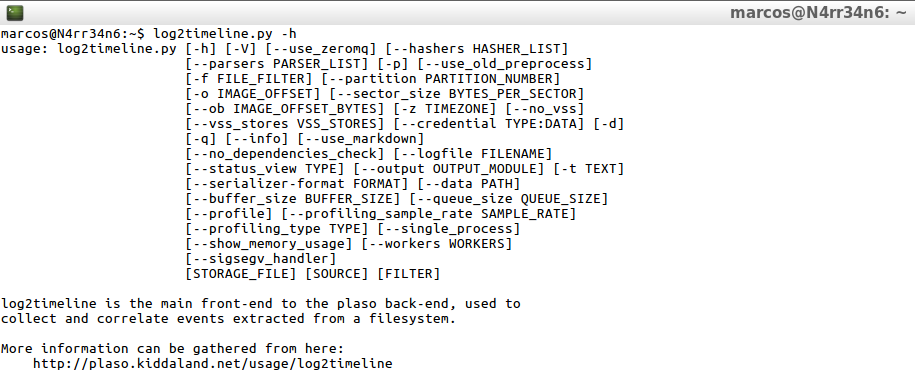
A very, very broad help is available, which I can see in general, through
log2timeline.py --info

Or see its options more specifically, starting with its parsers and plugins.
log2timeline.py --parsers list

Continuing with its list of supported hashes.
log2timeline.py --hashers list

Following its output formats.
log2timeline.py --output list

And ending with its list of time zones
log2timeline.py -z list

One seen all the help that this tool offers me, which is not small, and that will be useful for other tools of this set, what is its basic operation?
log2timeline.py /home/marcos/Evidences/Windows10x64/ImagenDiscoWindows10x64.plaso /home/marcos/Evidences/Windows10x64/ImagenDiscoWindos10x64
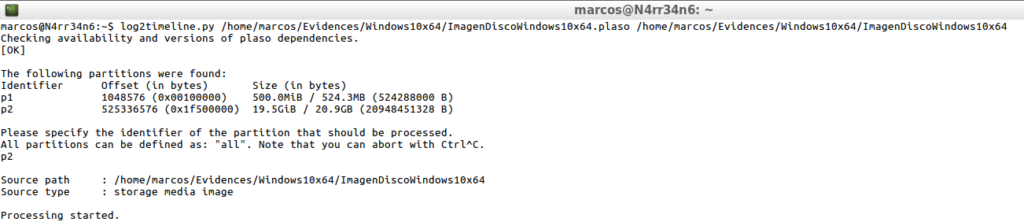
I invoke ‘Log2timeline’, I indicate the intermediate file, (‘Bodyfile’), on which I will work later and I indicate the file of the forensic image that I want to process. It will indicate the number of available partitions and will ask me which one I want to process. I select it.
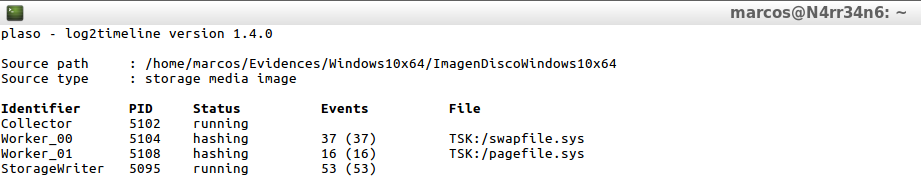
And the treatment of the forensic image begins, which I can see on the screen, until its completion.
Once it has finished and the intermediate file ‘.plaso’ has been generated, and that it is still a compressed file, how do I know what it has collected? With the following of the tools on which ‘Plaso’ works.
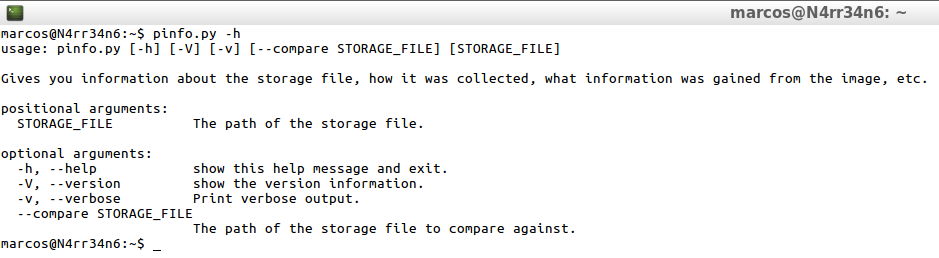
‘Pinfo‘, which is a command-line tool that provides me with information about the content of a storage plaso file. More exactly, it will give me information about:
When and how the tool was executed; Information collected during the preprocessing stage; Metadata on each storage container or warehouse; Which analyzers were used during the extraction phase, parameters used; How many extracted events are in the storage file and the number of each analyzer; If there are tagged events, which tag file was used, what tags have been applied and count for each one; If the analysis plugins have been executed, an overview of the ones that have been executed and the content of the report.
Its use is very simple
pinfo.py -h
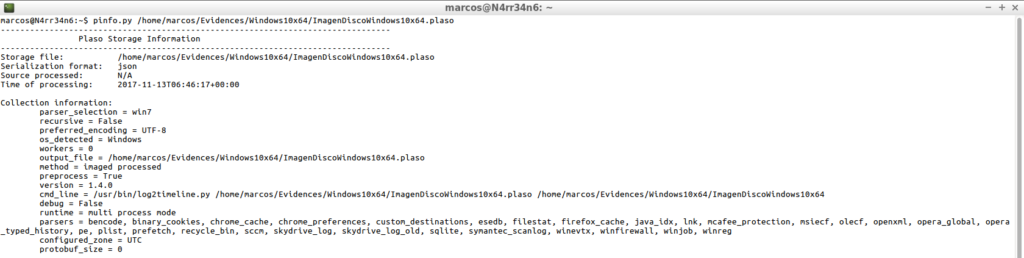
I can tell it to give me the information in a simple way.
pinfo.py /home/marcos/Evidences/Windows10x64/ImagenDiscoWindows10x64.plaso
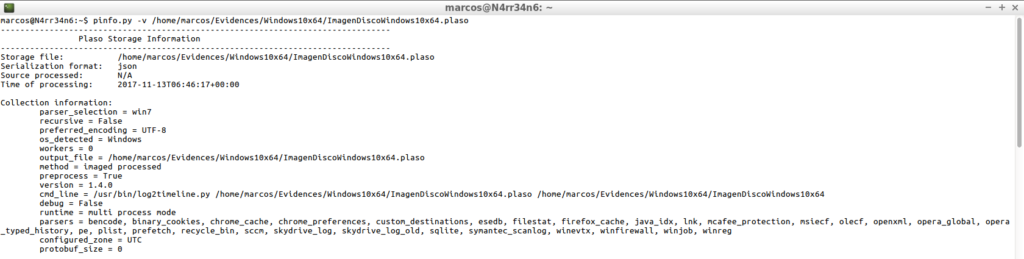
Or tell it to give it to me in a detailed way, which is what really interests me, because of the information that it will provide me with.
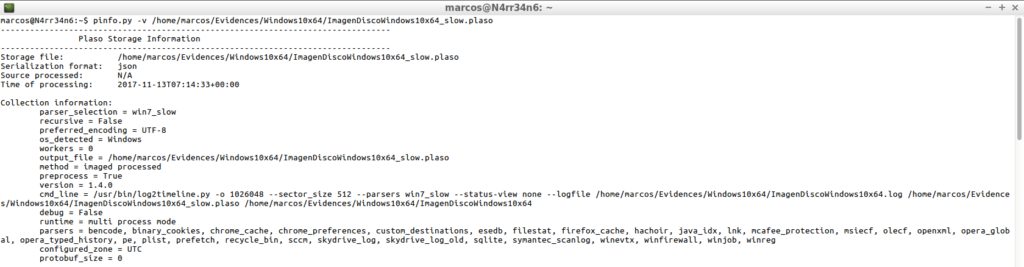
pinfo.py -v /home/marcos/Evidences/Windows10x64/ImagenDiscoWindows10x64.plaso
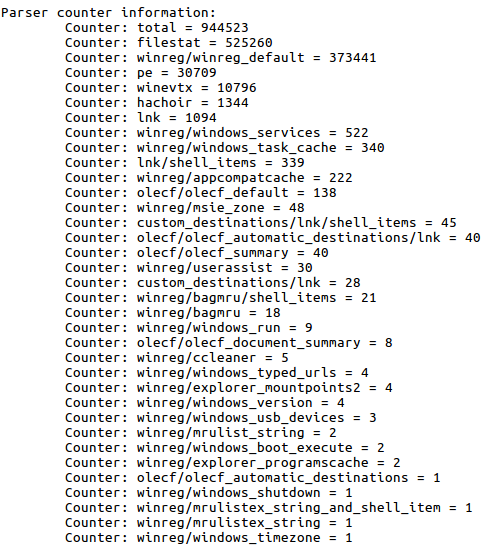
And, what information interests me about this report? Well, for example, the parsers used with the number of registered events.
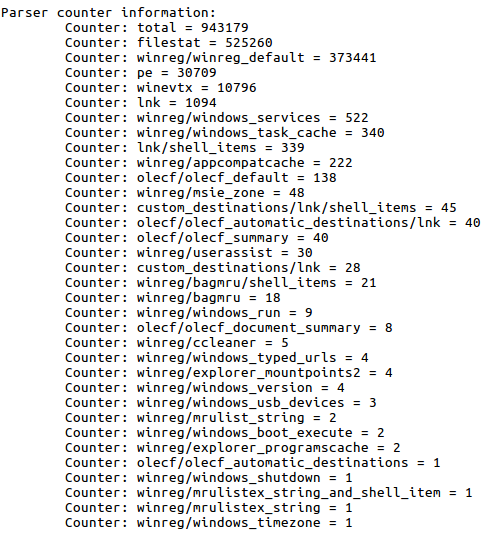
Or the information relative to the System object of the analysis.
I go back I have used ‘Log2timeline’ in a basic way, but it offers a much more advanced use.
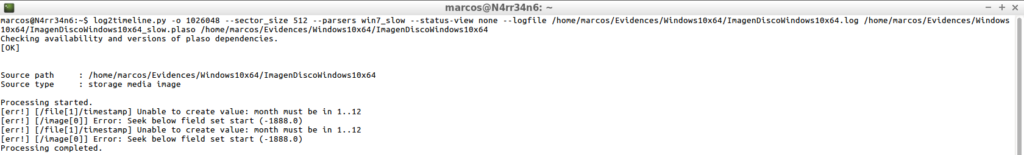
log2timeline.py -o 1026048 --sector_size 512 --parsers win7_slow --status-view none --logfile /home/marcos/Evidences/Windows10x64/ImagenDiscoWindows10x64.log /home/marcos/Evidences/Windows10x64/ImagenDiscoWindows10x64_slow.plaso /home/marcos/Evidences/Windows10x64/ImagenDiscoWindows10x64
What have I done with this line?
log2timeline.py – I invoke the tool
-o 1026048 – I indicate the sector of the partition that I want to process
–sector_size 512 – I indicate the size of the sector
–parsers win7_slow – I indicate the parser, (or parsers), that I want to use
–status-view none – I indicate that it do not show me the information that you process on screen, (I find it annoying)
–logfile – In exchange for not showing the information on the screen, I indicate to generate a file ‘.log’ with that information.
In this way, I will not have to keep an eye on the screen, nor will I be asked about the number of partitions I want to process, in addition to specifying the parser I want to use. Once it has finished, it will generate the indicated ‘.log’ file.
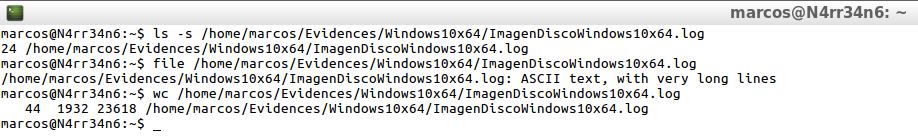
ls -s /home/marcos/Evidences/Windows10x64/ImagenDiscoWindows10x64.log
file /home/marcos/Evidences/Windows10x64/ImagenDiscoWindows10x64.log
wc /home/marcos/Evidences/Windows10x64/ImagenDiscoWindows10x64.log
I use ‘Pinfo’ again to see what information I have obtained, both in its simple form.
pinfo.py /home/marcos/Evidences/Windows10x64/ImagenDiscoWindows10x64_slow.plaso
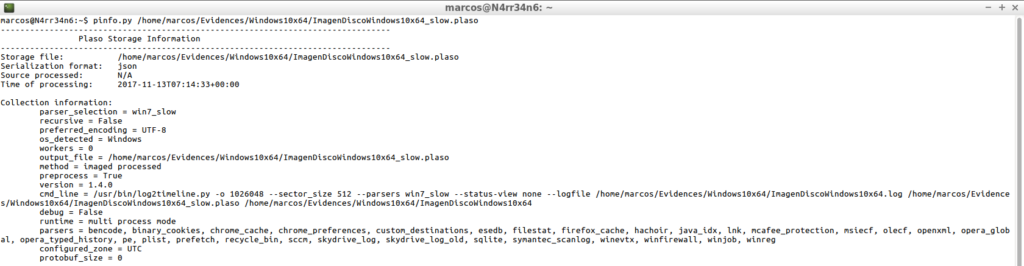
As in its detailed form.
pinfo.py -v /home/marcos/Evidences/Windows10x64/ImagenDiscoWindows10x64.log
And I’m going to be very interested, I stress, to look at the information it contains, relative to the used parsers and their counters.
As well as in the information of the System that can provide me.
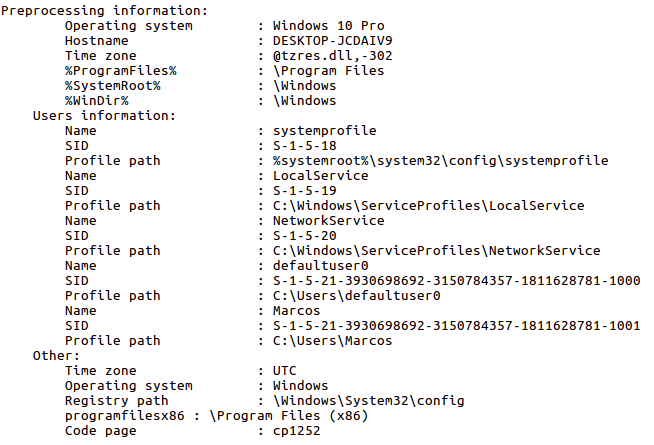
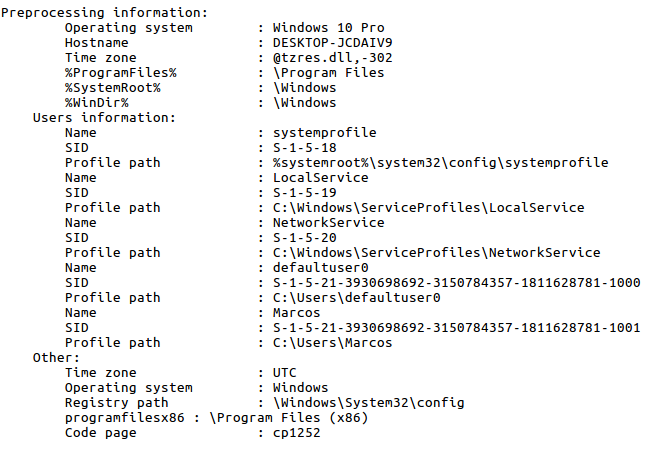
What information can provide me with the detailed view of ‘Pinfo’? The Operating System, the hostname, the users list, the time zone of the System, …
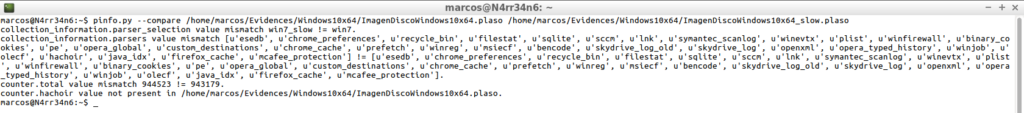
But now I want to compare what differences exist between the basic execution I did at the beginning and the ‘advanced’ that I have done now. I can do it very easily, using the ‘– compare’ parameter, which will show me the differences between one and the other.
pinfo.py --compare /home/marcos/Evidences/Windows10x64/ImagenDiscoWindows10x64.plaso /home/marcos/Evidences/Windows10x64/ImagenDiscoWindows10x64_slow.plaso
Very good. I have already created the intermediate file ‘.plaso’. But now, how do I give it shape, how do I make it readable?
For that, I use the following tool belonging to this framework, ‘Psort‘. ‘Psort’ is a command line tool for post processing of storage files. It allows to filter, order and execute the automatic analysis of the content of the storage files.
Like all the tools that this suite manages, it has its own help that should be consulted and that complements the help of ‘Log2timeline’.
psort.py -h
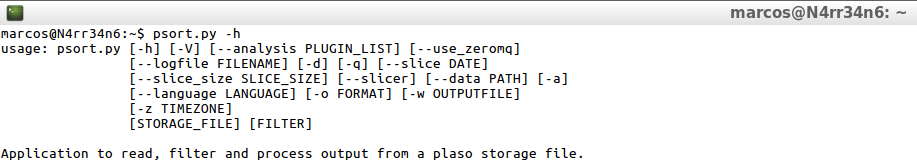
I can ask it for help on the list of analysis on which you can work.
psort.py --analysis list

I can ask for help on the list of time zones, as with ‘Log2timeline’.
psort.py -z list

And I can ask it for help about the output formats that it can process, as with ‘Log2timeline’, also.
psort.py -o list

All right. I have already seen the help it can offer me. Where do I begin? For its basic use.
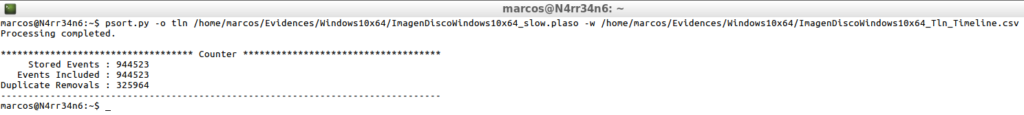
psort.py /home/marcos/Evidences/Windows10x64/ImagenDiscoWindows10x64_slow.plaso -w /home/marcos/Evidences/Windows10x64/ImagenDiscoWindows10x64_slow_Timeline.csv
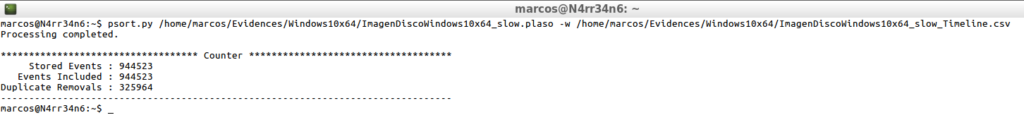
I just have to indicate the intermediate file ‘.plaso’ and an output file, using the parameter ‘-w’.
After processing, I get a summary that tells me the events stored, the events included and the events that have been duplicated and that have been eliminated.
Can I tell it not to delete any duplicate events? Of course yes.
psort.py -a /home/marcos/Evidences/Windows10x64/ImagenDiscoWindows10x64_slow.plaso -w /home/marcos/Evidences/Windows10x64/ImagenDiscoWindows10x64_slow_Timeline_All.csv

But, as I will realize later, it is not very productive because of the amount of information that I am going to discuss.
I have used ‘psort’ in a basic way and without indicating what type of output format to use. How will that information be presented?
cat -n /home/marcos/Evidences/Windows10x64/ImagenWindows10x64_slow_Timeline.csv | head -n 1

In its default output, it is presented in 10 columns, delimited by commas, with the information indicated in the header of each column, and is displayed in this way
cat -n /home/marcos/Evidences/Windows10x64/ImagenWindows10x64_slow_Timeline.csv | tail -n 1

It is evident that it contains a lot of information that, depending on the case that I am analyzing, will be of more or less useful to me and that may involve some difficulty in its interpretation.
I’m going to try some of the other types of output format that this tool offers me.
Output in l2tcsv format
psort.py -o l2tcsv /home/marcos/Evidences/Windows10x64/ImagenDiscoWindows10x64_slow.plaso -w /home/marcos/Evidences/Windows10x64/ImagenDiscoWindows10x64_L2tcsv_Timeline.csv
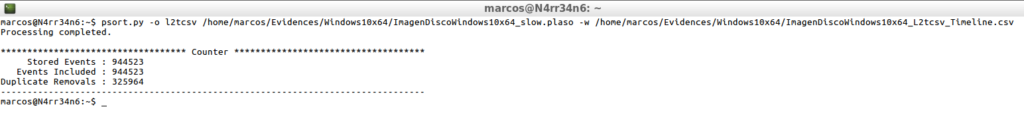
I will now see how the information is presented in this way.
cat -n /home/marcos/Evidences/Windows10x64/ImagenDiscoWindows10x64_L2tcsv_Timeline.csv | head -n 1

In its output in l2tcsv format, it is presented in 17 columns, delimited by commas, with the information indicated in the header of each column, and is displayed in this way
cat -n /home/marcos/Evidences/Windows10x64/ImagenDiscoWindows10x64_L2tcsv_Timeline.csv | tail -n 1

Output in l2ttln format.
psort.py -o l2ttln /home/marcos/Evidences/Windows10x64/ImagenDiscoWindows10x64_slow.plaso -w /home/marcos/Evidences/Windows10x64/ImagenDiscoWindows10x64_L2ttln_Timeline.csv
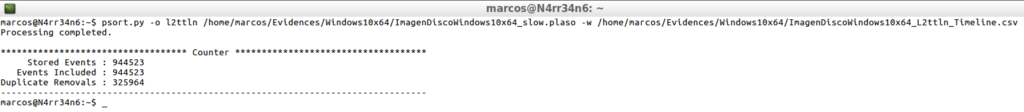
The information in this format is presented in this way.
cat -n /home/marcos/Evidences/Windows10x64/ImagenDiscoWindows10x64_L2ttln_Timeline.csv | head -n 1

In its output in l2ttln format, it is presented in 7 columns, delimited by pipeline, with the information indicated in the header of each column, and is displayed in this way.
cat -n /home/marcos/Evidences/Windows10x64/ImagenDiscoWindows10x64_L2ttln_Timeline.csv | tail -n 1

Output in tln format.
psort.py -o tln /home/marcos/Evidences/Windows10x64/ImagenDiscoWindows10x64_slow.plaso -w /home/marcos/Evidences/Windows10x64/ImagenDiscoWindows10x64_Tln_Timeline.csv
That is presented like this.
cat -n /home/marcos/Evidences/Windows10x64/ImagenDiscoWindows10x64_Tln_Timeline.csv | head -n 1

In its output in tln format, it is presented in 5 columns, delimited by pipeline, with the information indicated in the header of each column, and is displayed in this way
cat -n /home/marcos/Evidences/Windows10x64/ImagenDiscoWindowsx64_Tln_Timeline.csv | tail -n 1

As you can see, there are many output formats that can be adapted to the needs and purposes of each analysis. These formats are pre-established formats, which contain those columns, with that information, yes or yes.
On the other hand, it will not matter which one to use, in the sense that with all the formats I will obtain a line for each processed event, with a total of 618560 lines, in this case, (I remind you that it is a virtual hard disk of 20 GB). What would happen if I was presented with a 500GB or 1TB hard drive, which has suffered activity for a long period of time?
At this point, I must say that in most of the readings carried out on ‘Plaso’, it is almost always used for the generation of the timeline the tool ‘Psteal‘, which is capable of generating it directly, without no intermediate file, and that has a very simple use, being used.
psteal.py --source Imagen.dd -o l2tcsv -w Timeline.csv
But I would face all the problems mentioned above, related to the number of lines and the size of the generated file.
(«A cold sweat runs down my back»)
Honestly, I could adapt without any inconvenience. Because this tool allows me to make a dynamic output, where I am the one that selects the columns that I want presented to me. How does this mode work?
psort.py -o dynamic /home/marcos/Evidences/Windows10x64/ImagenDiscoWindows10x64_slow.plaso "select date,time,MACB,source,filename,inode" -w /home/marcos/Evidences/Windows10x64/ImagenDiscoWindows10x64_Dynamic_Timeline.csv

How will this information be presented, in this output format, where I have selected the columns?
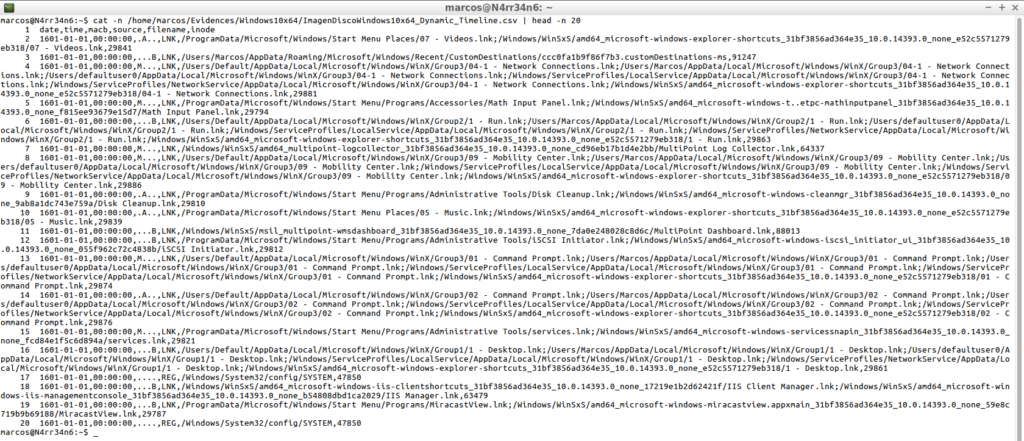
cat -n /home/marcos/Evidences/Windows10x64/ImagenDiscoWindows10x64_Dynamic_Timeline.csv | head -n 1

In its output in dynamic format, it is presented in 6 columns, (the ones I wanted to select), delimited by commas, with the information indicated in the header of each column, and is displayed in this way
cat -n /home/marcos/Evidences/Windows10x64/ImagenDiscoWindows10x64_Dynamic_Timeline.csv | tail -n 1

As you can see, this tool allows me to customize the output of the timelines, assigning a format to my measure. But I still have the same problem I had with ‘The Sleuth Kit’: The number of lines.
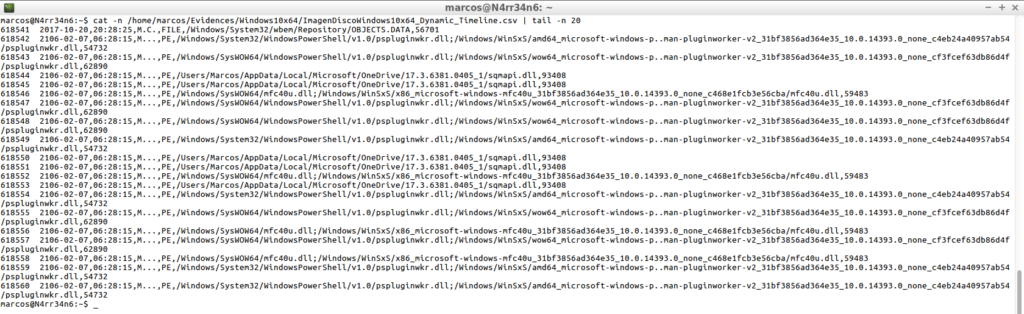
But before continuing, I’ll take a look at the firsts and last lines of this generated timeline.
cat -n /home/marcos/Evidences/Windows10x64/ImagenDiscoWindows10x64_Dynamic_Timeline.csv | head -n 20
cat -n /home/marcos/Evidences/Windows10x64/ImagenDiscoWindows10x64_Dynamic_Timeline.csv | tail -n 20
The size of the generated timeline can become a serious problem for the realization of its corresponding analysis, in addition to the number of lines. For example, in this case, with this 20 GB disk, the created file occupies more than 500 MB. What will occupy a current disc, with a long activity in the System?
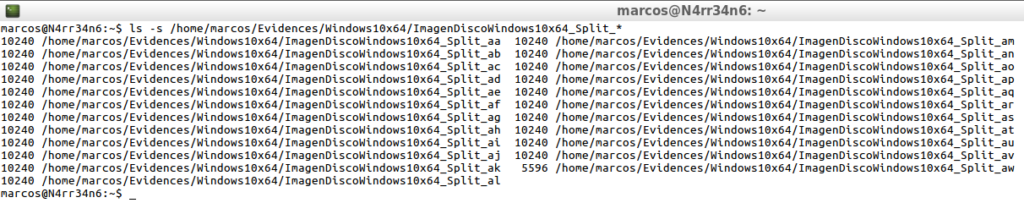
To solve this problem I can, calmly, split that temporary line into smaller files. For example, I divide it into 10 MB files.
psort.py -o dynamic /home/marcos/Evidences/Windows10x64/ImagenDiscoWindows10x64_slow.plaso | split -b 10m -w /home/marcos/Evidences/Windows10x64/ImagenDiscoWindows10x64_split_
![]()
And as many files will be generated as needed.
ls -s /home/Evidences/Windows10x64/ImagenDiscoWindows10x64_Split_*
On the other hand, this suite offers a very interesting option, which is to be able to filter events.
I mentioned earlier that it is very interesting to take a look at the detailed view of the ‘Pinfo’ module, and look at the parsers / plugins that have been used with their number of counters. The reason is because I can apply those filters, indicating, for example, that it filters all the events that it has processed whose resource contains ‘Winreg‘.
psort.py -o dynamic /home/marcos/Evidences/Windows10x64/ImagenDiscoWindows10x64_slow.plaso "select date,time,MACB,source,filename,inode where parser contains 'winreg'" -w /home/marcos/Evidences/Windows10x64/ImagenDiscoWindows10x64_slow_Timeline_Winreg.csv
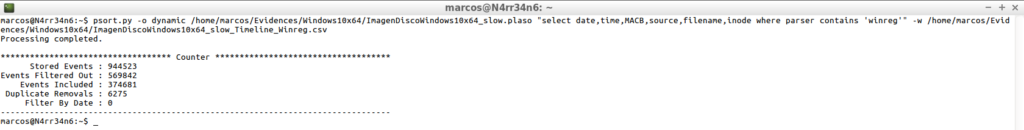
As you can see, I get results only from elements whose resource is only from the Windows Registry.
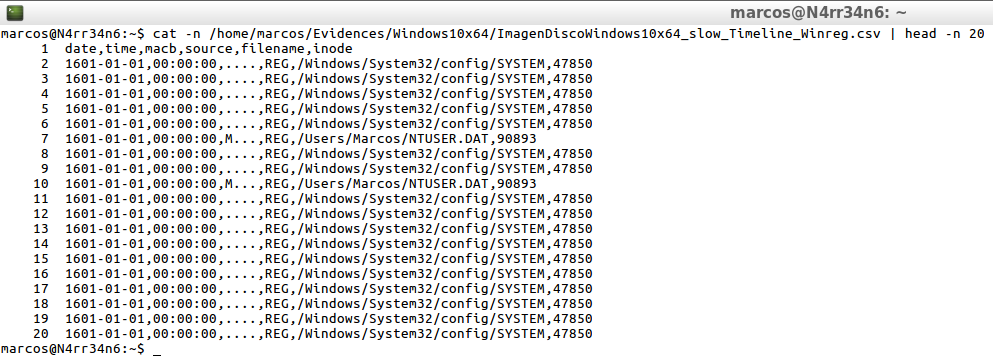
cat -n /home/marcos/Evidences/Windows10x64/ImagenDiscoWindows10x64_slow_Timeline_Winreg.csv | head -n 20
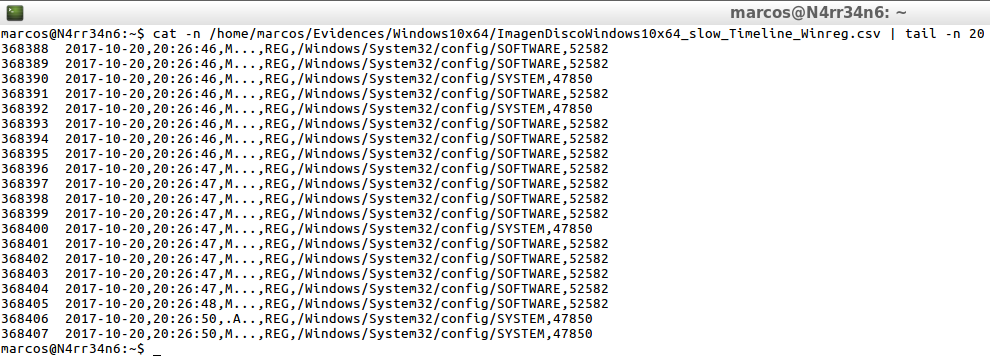
cat -n /home/marcos/Evidences/Windows10x64/ImagenDiscoWindows10x64_slow_Timeline_Winreg.csv | tail -n 20
The first thing that occurs to me is, for example, to filter the events using the ‘Filestat’ parser, which analyzes the data of the file system and returns information about the files.
psort.py -o dynamic /home/marcos/Evidences/Windows10x64/ImagenDiscoWindows10x64_slow.plaso "select date,time,MACB,source,filename,inode where parser is 'filestat'" -w /home/marcos/Evidences/Windows10x64/ImagenDiscoWindows10x64_slow_Timeline_Filestat.csv
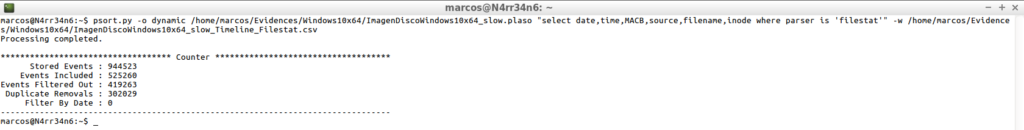
Only with this, the result, as can be seen, varies, both in content and in the extension of lines.
cat -n /home/marcos/Evidencias/Windows10x64/ImagenDiscoWindows10x64_slow_Timeline_Filestat.csv | head -n 20
cat -n /home/marcos/Evidencias/Windows10x64/ImagenDiscoWindows10x64_slow_Timeline_Filestat.csv | tail -n 20
Another option that occurs to me is to combine the filtering of ‘Filestat’ with ‘PE‘, (Portable Executable), so that I analyze and work with portable executable files.
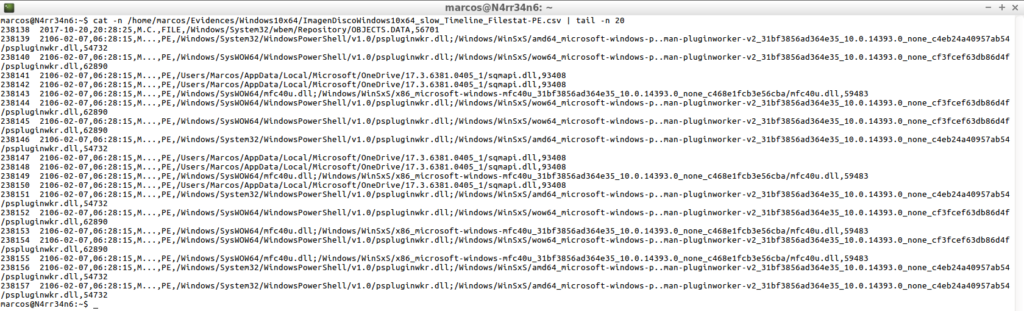
psort.py -o dynamic /home/marcos/Evidences/Windows10x64/ImagenDiscoWindows10x64_slow.plaso "select date,time,MACB,source,filename,inode where parser is 'filestat' or parser is 'pe'" -w /home/marcos/Evidences/Windows10x64/ImagenDiscoWindows10x64_slow_Timeline_Filestat-PE.csv
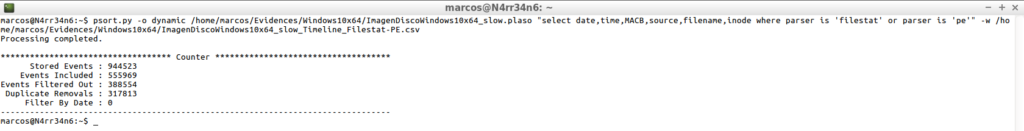
And again I get different results from the previous one, where the indicated filters are applied.
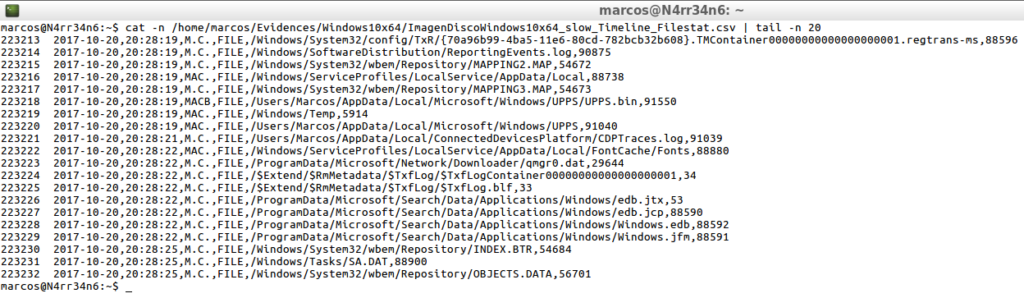
cat -n /home/marcos/Evidences/Windows10x64/ImagenDiscoWindows10x64_slow_Timeline_Filestat-PE.csv | head -n 20
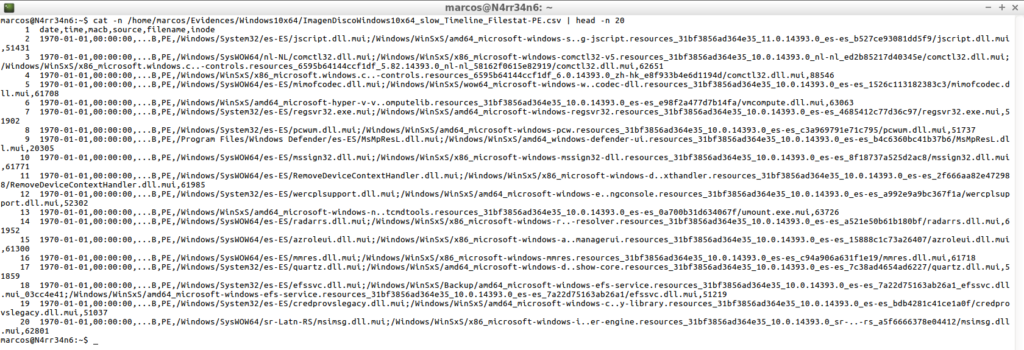
cat -n /home/marcos/Evidences/Windows10x64/ImagenDiscoWindows10x64_slow_Timeline_Filestat-PE.csv | tail -n 20
I find the use of filters with ‘Plaso’ very interesting. In fact, I want to be even more specific. After all, I know what I’m looking for. I would like to tell it to process only the parsers of ‘Filestat’ and ‘PE’ and, in addition, to indicate the content of the name of the file that I want you to show me.
psort.py -o dynamic /home/marcos/Evidences/Windows10x64/ImagenDiscoWindows10x64_slow.plaso "select date,time,MACB,source,filename,inode where parser is 'filestat' or parser is 'pe' where filename contains 'USBOblivion' or filename contains 'CCleaner' or filename contains 'WannaCry'" -w /home/marcos/Evidences/Windows10x64/ImagenDiscoWindows10x64_slow_Timeline_FileContains.csv
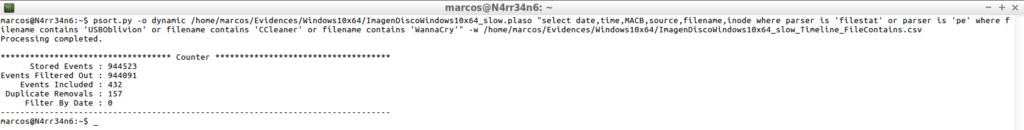
The thing changes and I’m starting to ‘come up‘.
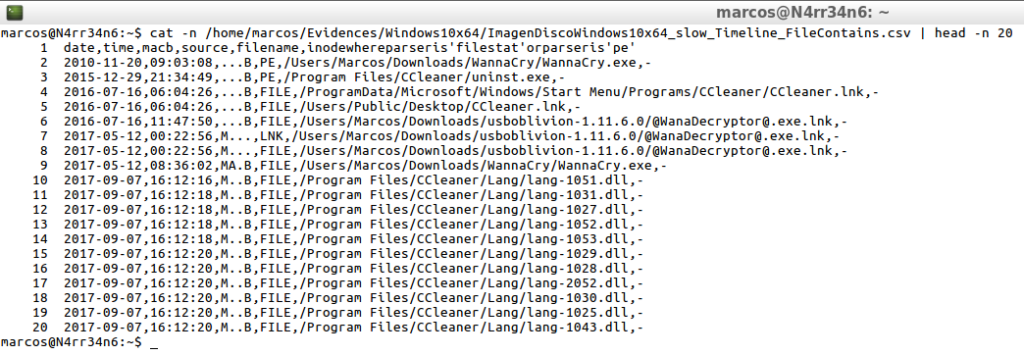
cat -n /home/marcos/Evidences/Windows10x64/ImagenDiscoWindows10x64_slow_Timeline_FileContains.csv | head -n 20
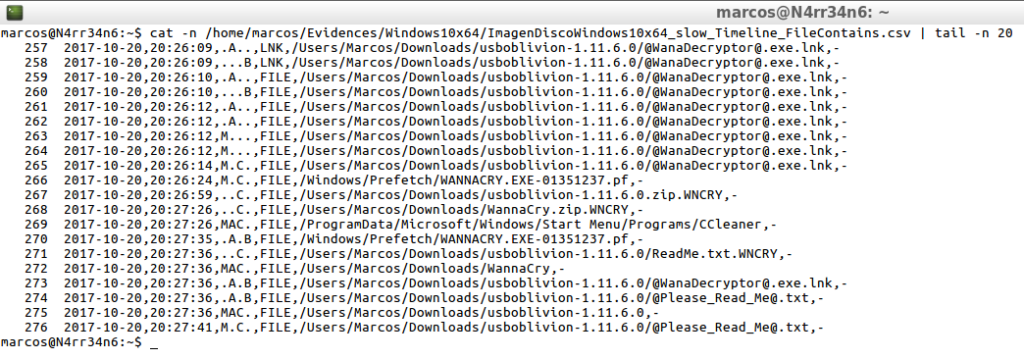
cat -n /home/marcos/Evidences/Windows10x64/ImagenDiscoWindows10x64_slow_Timeline_FileContains.csv | tail -n 20
I’m noticing that every time I process something with ‘Psort’, a field called ‘Filter By Date’ appears. Will it also allow me to filter by dates? Of course yes.
I can tell it, for example, to process the timeline equal to or greater than an assigned date
psort.py -o dynamic /home/marcos/Evidences/Windows10x64/ImagenDiscoWindows10x64_slow.plaso "select date,time,MACB,source,filename,inode where date >= '2017-10-20 00:00:00'" -w /home/marcos/Evidences/Windows10x64/ImagenDiscoWindows10x64_20171020.csv
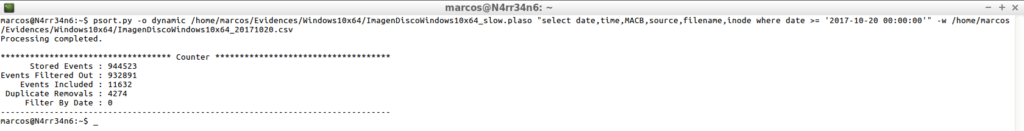
And it will only process events that occurred after the indicated date.
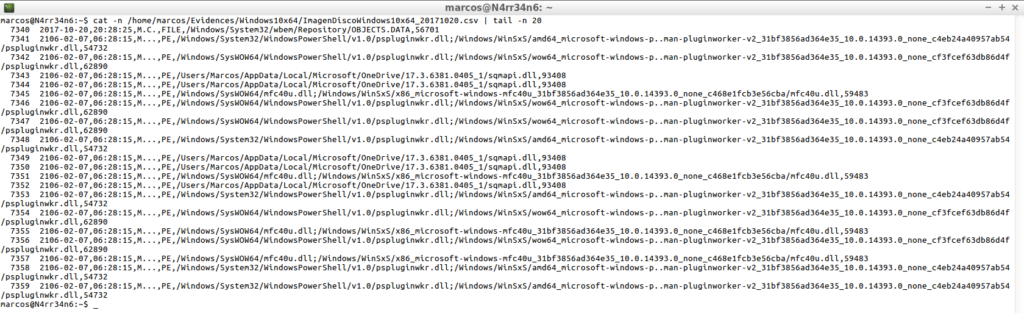
cat -n /home/marcos/Evidences/Windows10x64/ImagenDiscoWindows10x64_20171020.csv | head -n 20

cat -n /home/marcos/Evidences/Windows10x64/ImagenDiscoWindows10x64_20171020.csv | tail -n 20
Or indicate a range of dates, as I did with ‘The Sleuth Kit’.
psort.py -o dynamic /home/marcos/Evidences/Windows10x64/ImagenDiscoWindows10x64_slow.plaso "select date,time,MACB,source,filename,inode where date >= '2017-10-19 00:00:00' AND date << '20171020 23:59:59'" -w /home/marcos/Evidences/Windows10x64/ImagenDiscoWindows10x64_20171019-20.csv
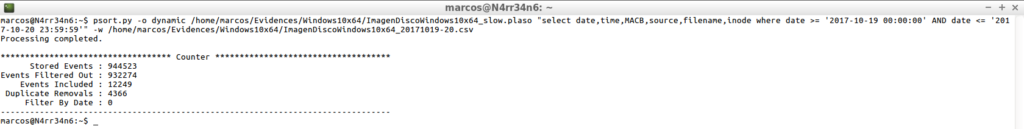
To process, from and to, the dates that I indicate.
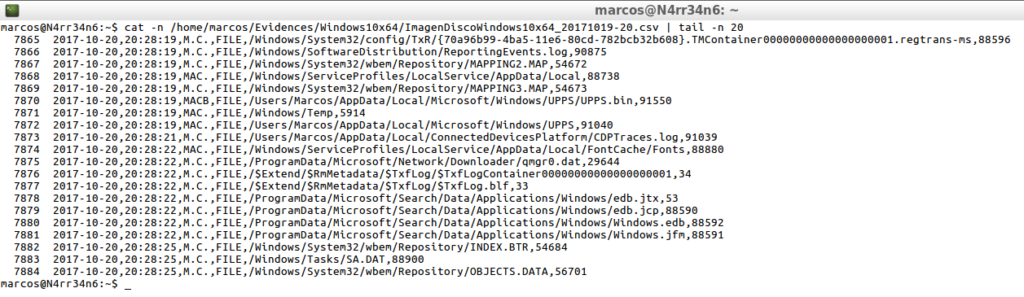
cat -n /home/marcos/Evidences/Windows10x64/ImagendiscoWindows10x64_20171019-20.csv | head -n 20

cat -n /home/marcos/Evidences/Windows10x64/ImagendiscoWindows10x64_20171019-20.csv | tail -n 20
From here, the limit is my imagination. I will always have some information to look for, some date, some name, some type of activity, …
Plaso, (Plaso Langar Að Safna Öllu) VS TSK, (The Sleuth Kit)
I will not show all the differences between the two main tools used to generate time lines. Both have their advantages and both have their drawbacks, as all tools and usefulness. As you know, each analysis is one world, different from another.
The first difference that I am going to see is going to be in the form of presenting the processed events, given that each suite presents them in different ways.
This is how ‘The Sleuth Kit’ presents it
cat -n /home/marcos/Evidences/Windows10x64/ImagenDiscoWindows10x64_20171020_Timeline.csv | head -n 1

And this is what ‘Plaso‘ presents, in the dynamic output that I’m interested in having.
cat -n /home/marcos/Evidences/Windows10x64/ImagenDiscoWindows10x64_20171020.csv | head -n 1

Yes I want to show the main one, in my point of view, to take into account, and it is the processing time of each of them, with respect to the information that can be extracted from the forensic image.
I have already commented that the two suites can work directly on forensic image files, without intermediate files.
I will generate the ‘Bodyfile’ with both suites.
First with ‘The Sleuth Kit’
time fls -rpl -o 1026048 -f ntfs -i raw -b 512 -m / /home/marcos/Evidences/Windows10x64/ImagenDiscoWindows10x64 >> /home/marcos/Evidences/Windows10x64/Win10x64_BodyFile.txt

The result is that it took 17.036 seconds to process the image to generate the ‘Bodyfile’.
I’m going with ‘Plaso’ now.
time log2timeline.py -o 1026048 --sector_size 512 --status-view none --logfile /home/marcos/Evidences/Windows10x64.plaso /home/marcos/Evidences/Windows10x64/ImagenDiscoWindows10x64
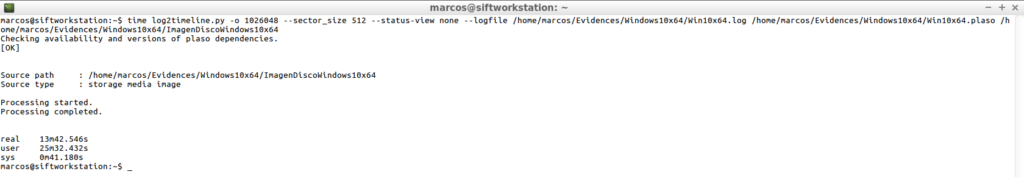
And the result is that it took 13,42,546 minutes to process the image to generate the storage file ‘.plaso’
I will search for a specific content, directly and on the same forensic image, to be able to see the time that each of them takes, using, for that, a ‘time‘.
First with ‘The Sleuth Kit’.
time fls -rp -o 1026048 -f ntfs -i raw -b 512 /home/marcos/Evidences/Windows10x64/ImagenDiscoWindows10x64 | egrep -i "WannaCry|USBOblivion|CCleaner" | egrep -vi "[.]dll"
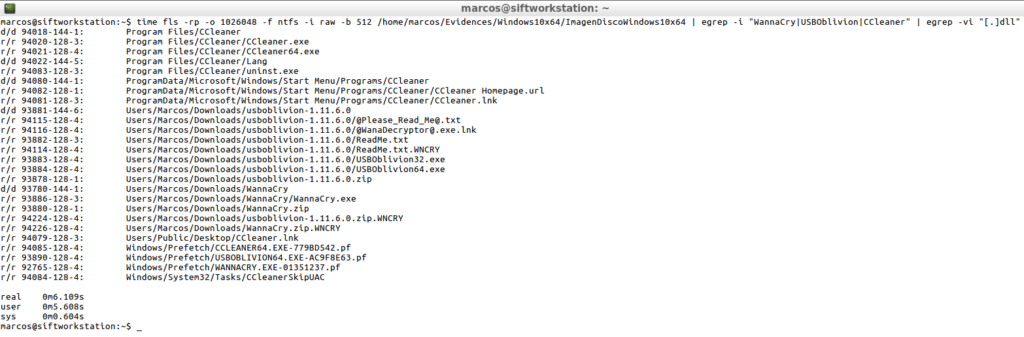
The result is that it has taken in processing, in performing this search, it is 6.109 seconds.
I’m going with ‘Plaso’ now.
time psort.py -o dynamic /home/marcos/Evidences/Windows10x64/ImagenDiscoWindows10x64_slow.plaso "select date, time,MACB,source,filename,inode where parser is 'filestat' or parser is 'pe' and date >= '2017-10-20 00:00:00'" | egrep -i "WannaCry|USBOblivion|CCleaner" | egrep -vi "[.]dll"
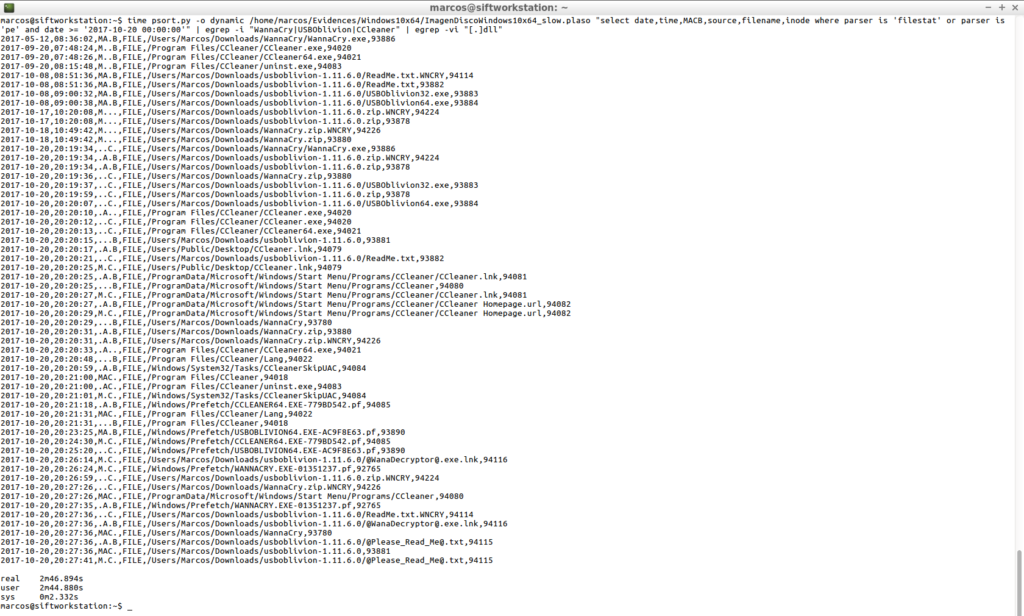
And the result is that it has taken in processing, in carrying out this search, it is 2.46.094 minutes.
AnalyzeMFT
If there is something that my head can not conceive is to ignore a timeline of the ‘MFT’, since in NTFS systems, all data files, directories and metafiles, are stored in this table of files, as metadata. And, why can not I miss a time line of the ‘MFT’? Because I consider it necessary to establish a timeline of this table of files, independent of the rest of the collected events. Because I will not always have a forensic image of the hard drive. For example, in cases where you have to apply some type of triage because they are a large number of computers, or because you do not know the patient ‘0’, I can only have this file, along with other artifacts.
AnalyzeMFT, written in Python, is designed to fully analyze the MFT file from an NTFS file system and present the results as accurately as possible in multiple formats.
Instructions for installing this tool can be found on its official GitHub site.
Since it works with multiple formats in its output, I consider it necessary to see its help, since it could be of interest to establish one type of line or another, depending on the case.
analyzeMFT.py -h
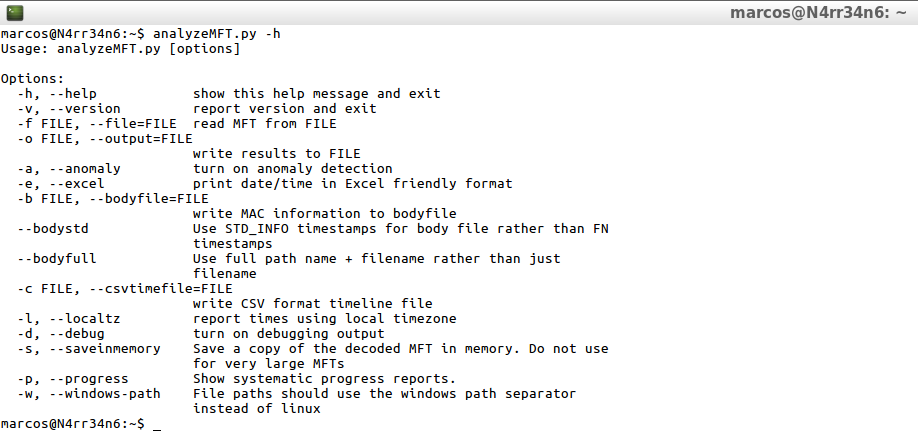
I will show all your forms of work.
First, its basic use.
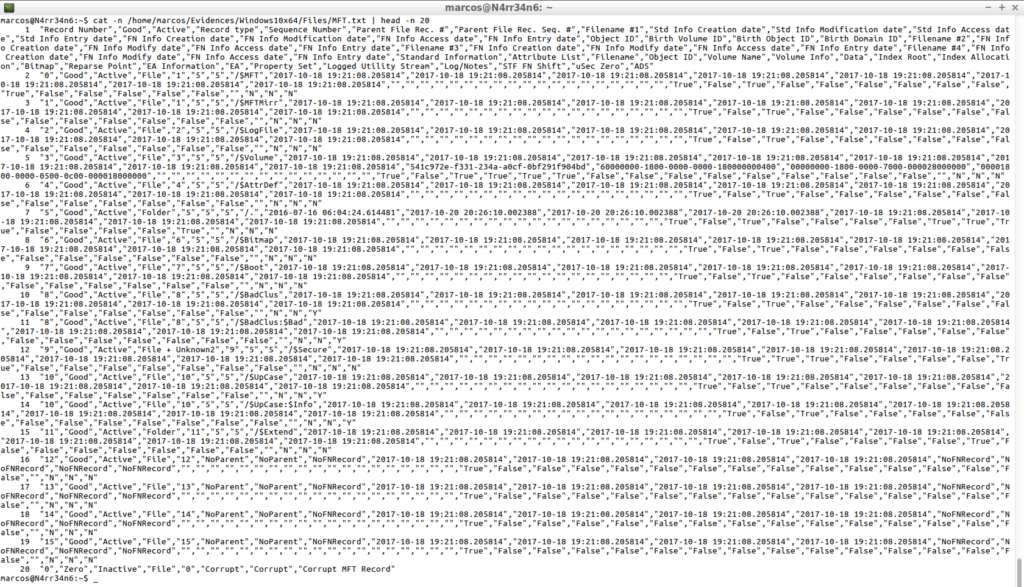
analyzeMFT.py -f /home/marcos/Evidences/Windows10x64/Files/MFT -o /home/marcos/Evidences/Windows10x64/Files/MFT.txt

That is presented in this way.
cat -n /home/marcos/Evidences/Windows10x64/Files/MFT.txt | head -n 20
I’m going now with the output in Excel format.
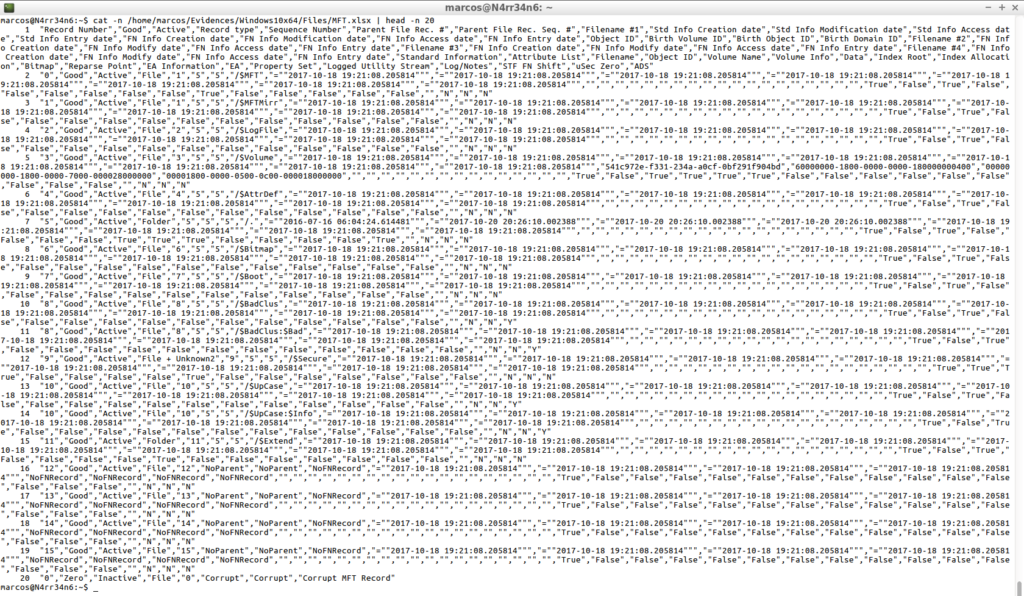
analyzeMFT.py -f /home/marcos/Evidences/Windows10x64/Files/MFT -e -o /home/marcos/Evidences/Windows10x64/Files/MFT.xlsx

That is presented in this way.
cat -n /home/marcos/Evidences/Windows10x64/Files/MFT.xlsx | head -n 20
I’m going now with its output in ‘.csv’ format
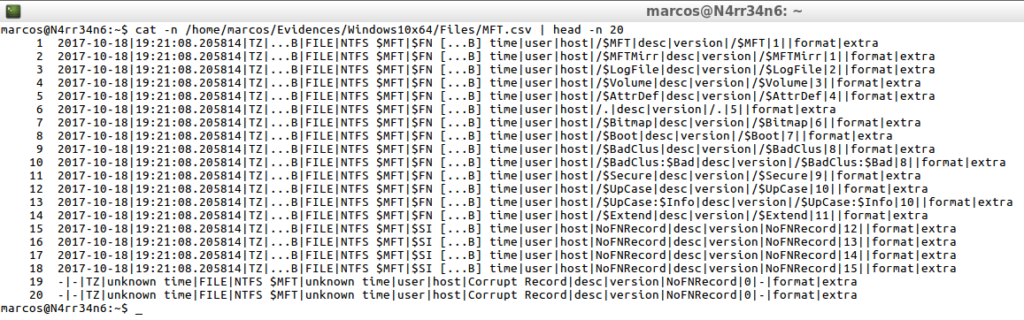
analyzeMFT.py -f /home/marcos/Evidences/Windows10x64/Files/MFT -c /home/marcos/Evidences/Windows10x64/Files/MFT.csv

That is presented in this way.
cat -n /home/marcos/Evidences/Windows10x64/Files/MFT.csv | head -n 20
One option that has this tool is the ability to generate a ‘Bodyfile’ of the ‘MFT’, with two alternatives, also very interesting.
The first of them.
analyzeMFT.py -f /home/marcos/Evidences/Windows10x64/Files/MFT -b /home/marcos/Evidences/Windows10x64/Files/MFT_Bodyfile.txt

That is presented in this way.
cat -n /home/marcos/Evidences/Windows10x64/Files/MFT_Bodyfile.txt | head -n 20
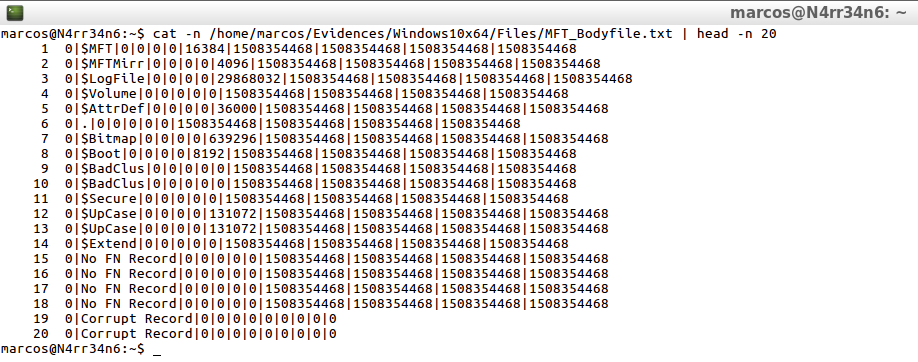
In this way of working, the timeline will be generated in such a way that the names of the files are readable in an MS-DOS format. That is to say that, if for example, a file name that is too long, or with special characters, is found in this table of files, the System is in charge of converting that name, to another of six characters, followed by a tilde ‘~’ and of a correlative number, in case of duplicate file names.
And the second one, which is processed like this.
analyzeMFT.py -f /home/marcos/Evidences/Windows10x64/Files/MFT --bodyfull -b /home/marcos/Evidences/Windows10x64/Files/MFT_Full_Bodyfile.txt

And it is presented thus.
cat -n /home/marcos/Evidencias/Windows10x64/Files/MFT_Full_Bodyfile.txt | head -n 20
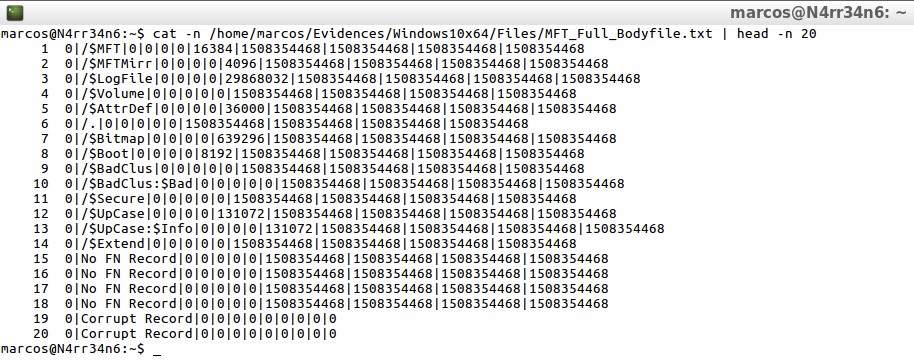
With this second way of generating a ‘Bodyfile’ what I get is that I recorded in the timeline, the full path and its full file name.
There is a third way to work with this tool, to generate a ‘Bodyfile’, and is to produce a backslash on the timeline, adding the argument ‘-w’.
analyzeMFT.py -f /home/marcos/Evidences/Windows10x64/Files/MFT -w --bodyfull -b /home/marcos/Evidences/Windows10x64/Files/MFT_Full_Bodyfile_w.txt

That is presented in this way.
cat -n /home/marcos/Evidences/Windows10x64/Files/MFT_Full_Bodyfile_w.txt | head -n 20
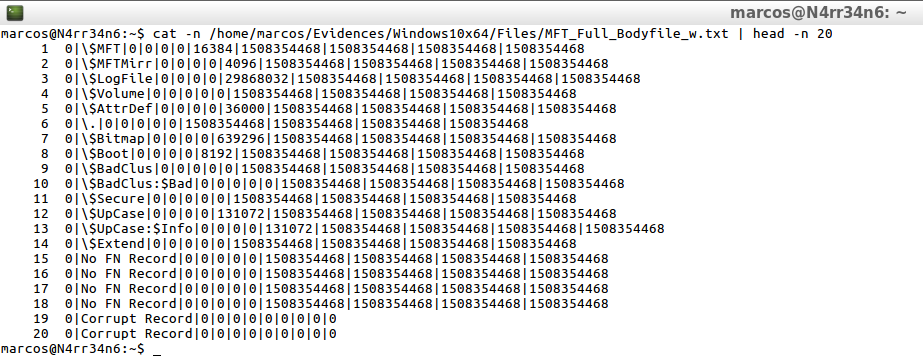
Clearly, you can see the only difference between using the parameter ‘-w’ or not.
But, why would I want to generate a ‘Bodyfile’ of the ‘MFT’? Well for exactly the same thing that I did with ‘The Sleuth Kit’. To process it, immediately, with ‘Mactime’. And its operation is exactly the same.
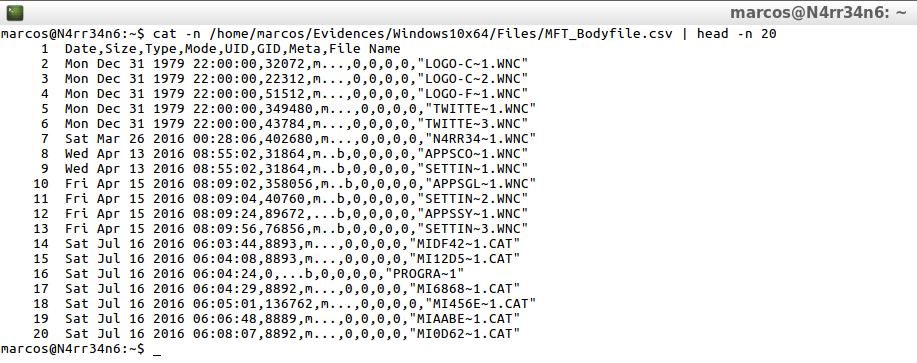
I can tell it to delimit the timeline by commas.
mactime -d -b /home/Evidences/Windows10x64/Files/MFT_Bodyfile.txt >> /home/marcos/Evidences/Windows10x64/Files/MFT_Bodyfile.csv

That would be displayed in this way.
cat -n /home/marcos/Evidences/Windows10x64/Files/MFT_bodyfile.csv | head -n 20
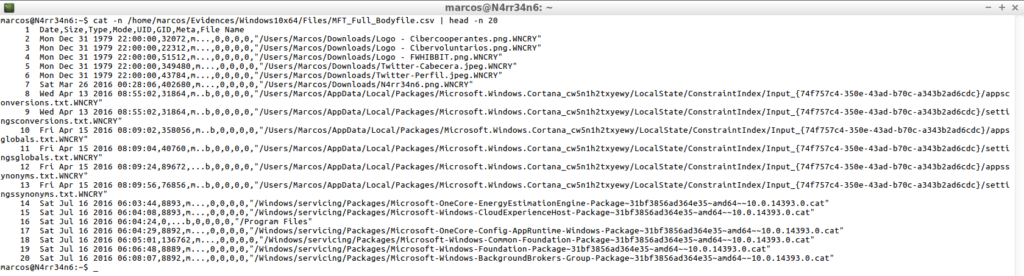
mactime -d -b /home/Evidences/Windows10x64/Files/MFT_Full_Bodyfile.txt >> /home/marcos/Evidences/Windows10x64/Files/MFT_Full_Bodyfile.csv
![]()
cat -n /home/marcos/Evidences/Windows10x64/Files/MFT_Full_Bodyfile.csv | head -n 20
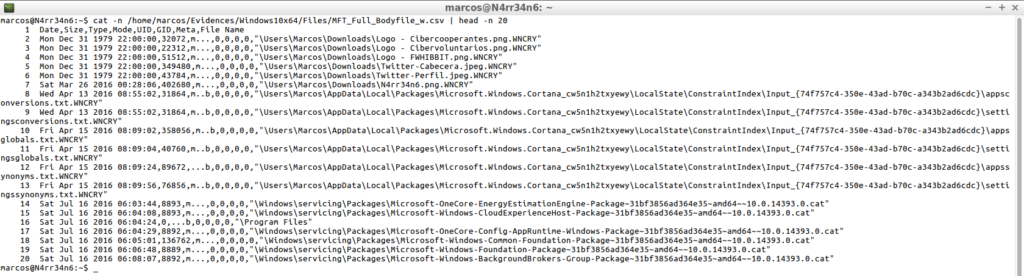
mactime -d -b /home/Evidences/Windows10x64/Files/MFT_Full_Bodyfile_w.txt >> /home/marcos/Evidences/Windows10x64/Files/MFT_Full_Bodyfile_w.csv

cat -n /home/marcos/Evidences/Windows10x64/Files/MFT_Full_Bodyfile_w.csv | head -n 20
Or I can indicate that it do not delimit me the timeline and that It tabulate the columns.
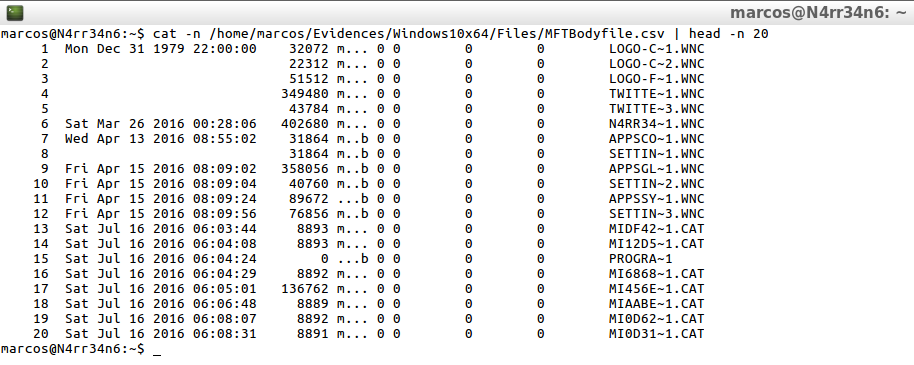
mactime -b /home/Evidences/Windows10x64/Files/MFT_Bodyfile.txt >> /home/marcos/Evidences/Windows10x64/Files/MFTBodyfile.csv

That would be represented in this way.
cat -n /home/marcos/Evidences/Windows10x64/Files/MFTBodyfile.csv | head -n 20
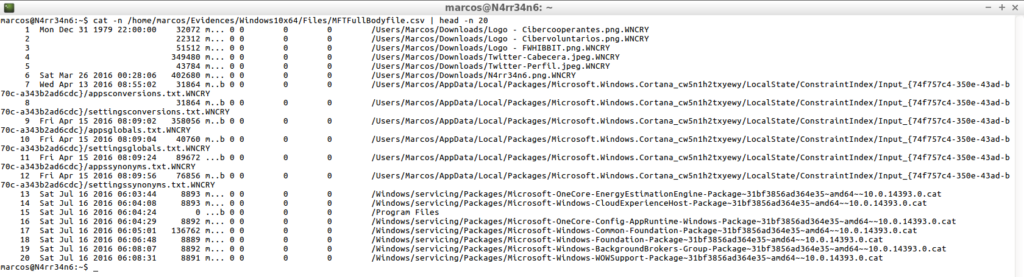
mactime -b /home/marcos/Evidences/Windows10x64/Files/MFT_Full_Bodyfile.txt >> /home/marcos/Evidences/Windows10x64/Files/MFTFullBodyfile.csv

cat -n /home/marcos/Evidences/Windows10x64/Files/MFTFullBodyfile.csv | head -n 20
From here, the limit is my imagination. I will always have some information to look for, some date, some name, some type of activity, …
The limit … Imagination
Surely you are asking yourself at this moment why I say that the limit is the imagination. It is easy. I can generate timelines with many tools, in many ways, even giving a personalized touch to the processed content.
I can later open these timelines, as they have been generated, with some office application. Or, for example, I can format it as a table on an Excel sheet, I can use a very interesting Excel template, which will color each of the events, taking into account their origin.
Or I can open that timeline with another more specific application, such as, for example, Timeline Explorer, which has very interesting options.
Or I can play with CLI and ‘Egrep’, a more interesting option and a feeling that I like to experience from time to time.
I will always have some information to look for, some date, some name, some type of activity, …
Okay come on. Not always, no. Insurance? How about an excess of activity, activity outside the normal schedule of the System, …
For example, I can search for users on the timeline without the need to mount the image.
First an example with ‘The Sleuth Kit‘
cat -n /home/marcos/Evidences/Windows10x64/ImagenDiscowindows10x64_20171020_Timeline.csv | egrep -io "[/]Users[/][a-aA-Z0-9]*[/]| sort | uniq

After an example with ‘Plaso‘
cat -n /home/marcos/Evidences/Windows10x64/ImagenDiscowindows10x64_20171020.csv | egrep -io "[/]Users[/][a-aA-Z0-9]*[/]| sort | uniq

I can search the content that I want in the timelines that I have made. For example, the ‘Prefetch‘ files, another fundamental pillar of any forensic analysis.
First, with ‘The Sleuth Kit‘
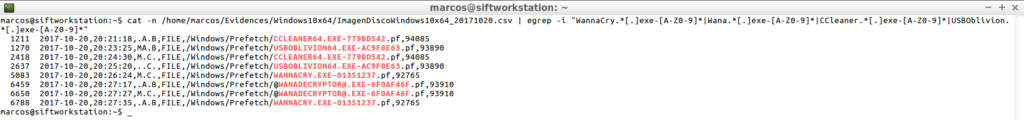
cat -n /home/marcos/Evidences/Windows10x64/ImagenDiscoWindows10x64_20171020_Timeline.csv | egrep -i "WannaCry.*[.]exe-[A-z0-9]*|Wana.*[.]exe-[A-z0-9]*|CCleaner.*[.]exe-[A-z0-9]*|USBOblivion.*[.]exe-[A-z0-9]*"
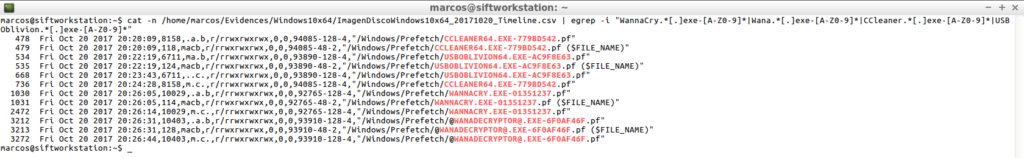
After, with ‘Plaso‘
cat -n /home/marcos/Evidences/Windows10x64/ImagenDiscoWindows10x64_20171020.csv | egrep -i "WannaCry.*[.]exe-[A-z0-9]*|Wana.*[.]exe-[A-z0-9]*|CCleaner.*[.]exe-[A-z0-9]*|USBOblivion.*[.]exe-[A-z0-9]*"
Or something more generic, such as searching for content within some user’s folders, excluding other content.
First with ‘The Sleuth Kit‘
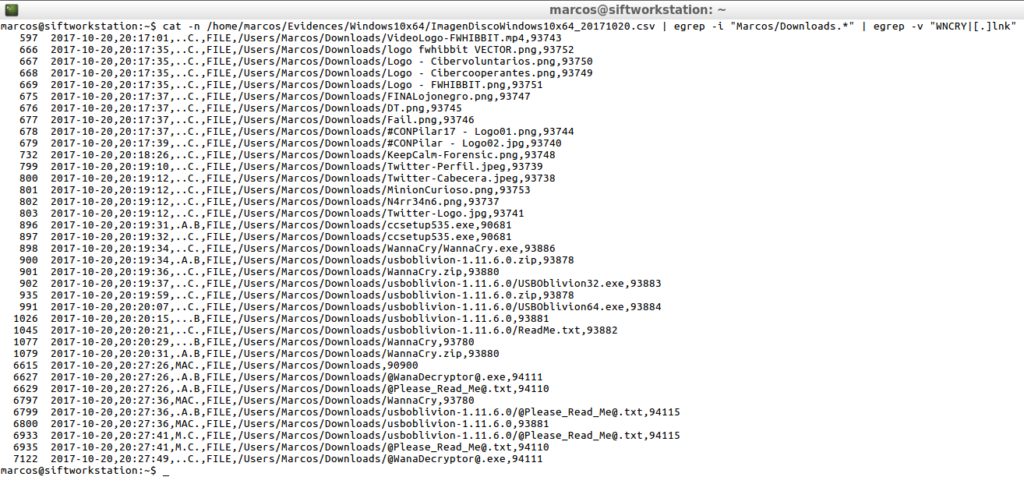
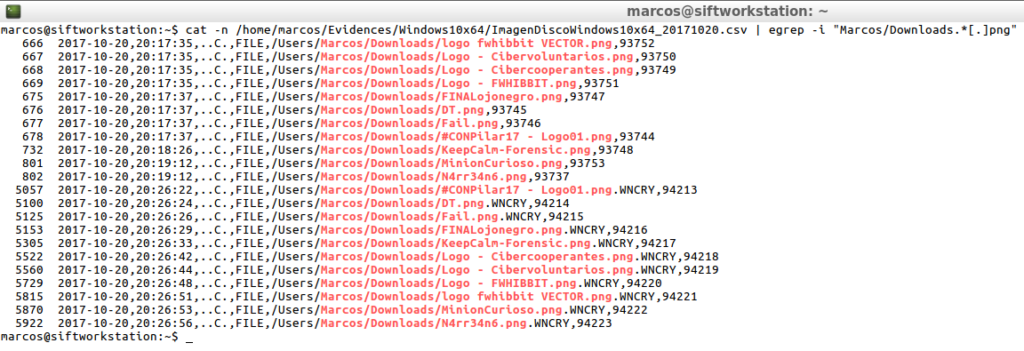
cat -n /home/marcos/Evidences/Windows10x64/ImagenDiscoWindows10x64_20171020_Timeline.csv | egrep -i "Marcos/Downloads.*" | egrep -v "WNCRY|[.]lnk"
After, with ‘Plaso’
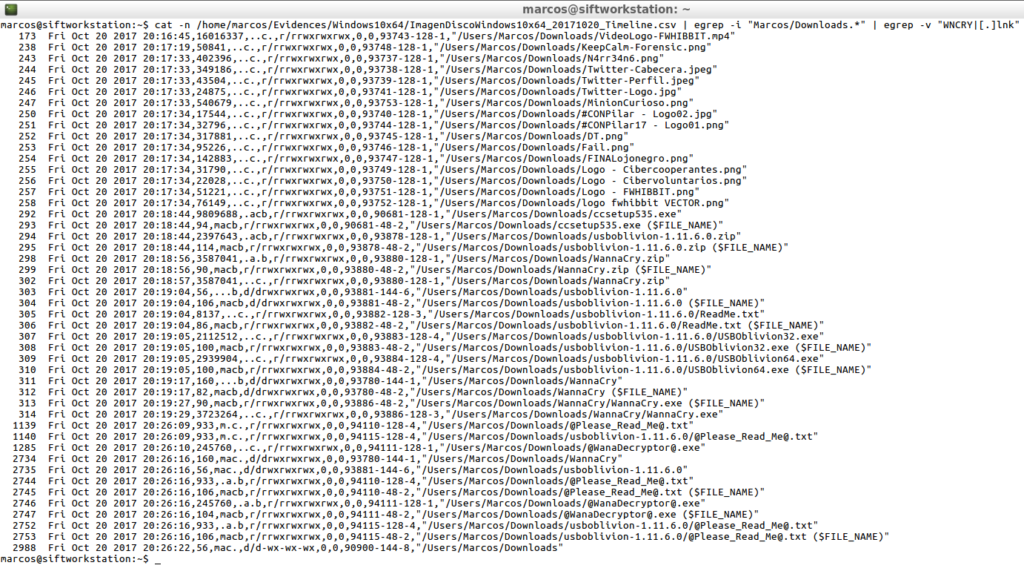
cat -n /home/marcos/Evidences/Windows10x64/ImagenDiscoWindows10x64_20171020.csv | egrep -i "Marcos/Downloads.*" | egrep -v "WNCRY|[.]lnk"
Or, of course, look for a specific file type
First with ‘The Sleuth Kit‘
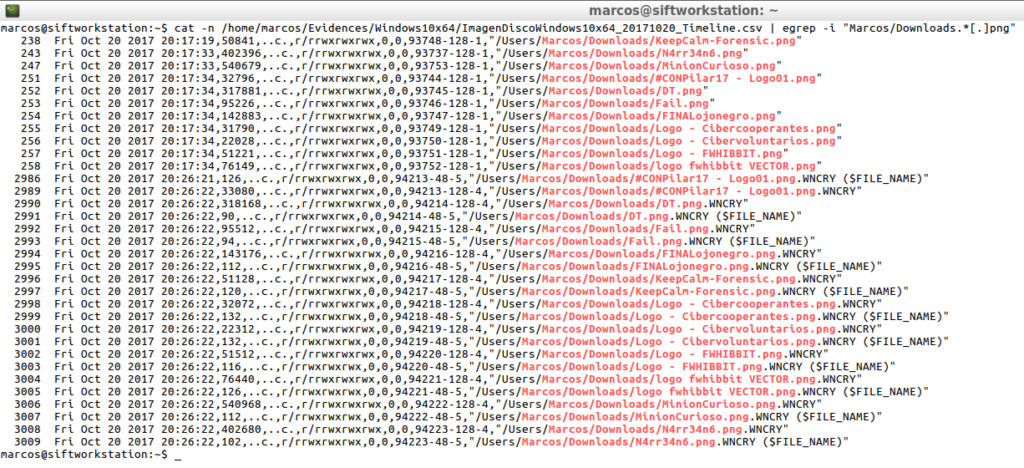
cat -n /home/marcos/Evidences/Windows10x64/ImagenDiscoWindows10x64_20171020_Timeline.csv | egrep -i "Marcos/Downloads.*[.]png"
And after, with ‘Plaso’
cat -n /home/marcos/Evidences/Windows10x64/ImagenDiscoWindows10x64_20171020.csv | egrep -i "Marcos/Downloads.*[.]png"
As you can imagine, the only limit is… the imagination. Whether you know what to look for or not, CLI offers a world full of possibilities.
Mount a forensic image…
It has always been said, and I also include myself there, that you always have to mount the image in read-only mode. This is a truth like a temple. This is a golden rule that should never be broken. But…
What is the purpose of mounting the forensic image? Exploring the image? I have already seen the world of possibilities that I have to do that, without having to mount the image. To extract a copy of files of the forensic image? Perhaps … Neither, because both ‘The Sleuth Kit’ and ‘Plaso’ have modules to proceed with the extraction of content from the forensic image.
First I will try this function with ‘The Sleuth Kit‘
For example, I am interested, and much, to extract a copy of the file ‘$MFT‘, (A file of vital importance in any type of analysis), of the forensic image. First, I look for it, using ‘FLS’ for it.
fls -rpl -o 1026048 -f ntfs -i raw -b 512 /home/marcos/Evidences/Windows10x64/ImagenDiscoWindows10x64 | egrep "[$]MFT"

Once the file is located inside the forensic image, I can see all its details, including its position on the hard disk, (inode). Since I have its location, I can use another of the ‘TSK’ tools: ‘Istat‘, which will show me the details of that file on a specific metadata structure.
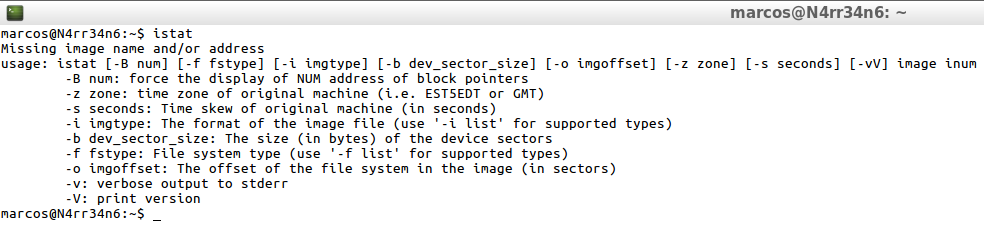
How does ‘Istat’ work? It has a very simple use. As always, if it have help, I see it
istat
So, I proceed to export all the information in that file to a text file, where I can consult it later calmly.
istat -i raw -f ntfs -o 1026048 /home/marcos/Evidences/Windows10x64/ImagenDiscoWindows10x64 0-128-6 >> /home/marcos/Evidences/Windows10x64/MFT_istat.txt
![]()
Once exported, first, the detailed information about this file, how is it presented?
cat -n /home/marcos/Evidences/Windows10x64/MFT_istat.txt | head -n 29
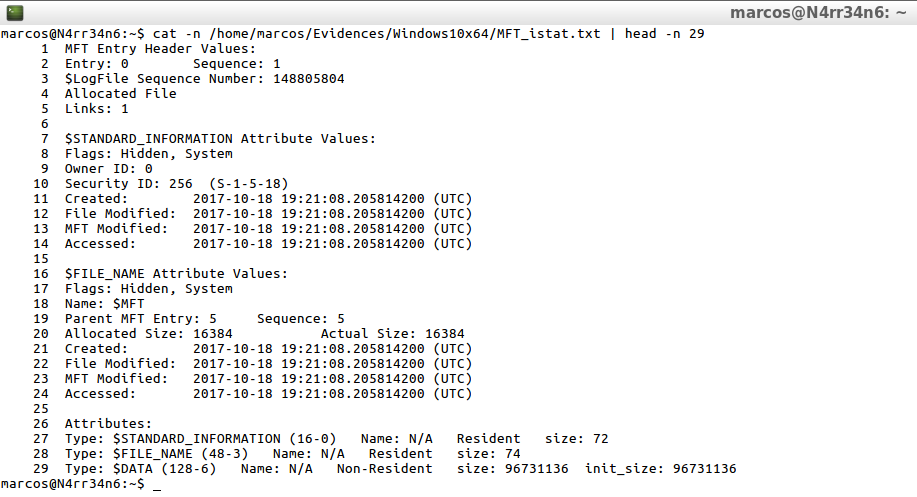
I can visualize all the attributes of this file, with their corresponding timestamps.
Now I am interested in proceeding to extract a copy, unaltered, of that same file. ‘TSK’ has another module: ‘Icat‘, which proceeds to send the contents of a file in a disk forensic image, to a specified path.
I consult its help, because it also has
icat

And, as I have its location on the disk, I proceed to the extraction.
icat -r -o 1026048 -f ntfs -i raw /home/marcos/Evidences/Windows10x64/ImagenDiscoWindows10x64 0-128-6 >> /home/marcos/Evidences/Windows10x64/Files/MFT
![]()
And I have the ugly mania to always check what I do
ls -s /home/marcos/Evidences/Windows10x64/Files/MFT
file /home/marcos/Evidences/Windows10x64/Files/MFT

I will locate and extract now, that same file, with ‘Plaso‘
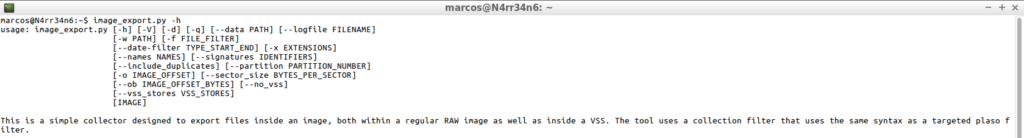
To do this, ‘Plaso’ offers me a module called ‘Image_Export‘, which has its own help and which I consult, as usual with me.
image_export.py -h
Its use is really simple. Once I have located the name of a file that I want to export, I just have to indicate it to ‘Image_Export’, with an output path. For example, I am going to re-export the file ‘$MFT’ of the forensic image, as I did previously with ‘The Sleuth Kit’.
image_export.py -o 1026048 --names '$MFT' /home/marcos/Evidences/Windows10x64/ImagenDiscoWindows10x64 -w /home/marcos/Evidences/Windows10x64/Files

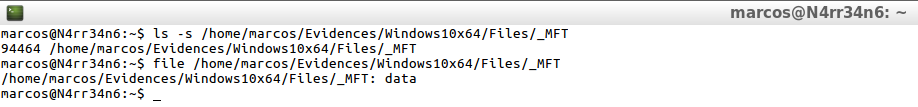
And, of course, I always check and make sure of what I do.
ls -s /home/marcos/Evidences/Windows10x64/Files/_MFT
file /home/marcos/Evidences/Windows10x64/Files/_MFT
And, now, to check if I have exported the same files, both with ‘The Sleuth Kit’, and with ‘Plaso’, I check them at the same time, including their hash.
ls -s /home/marcos/Evidences/Windows10x64/Files/*
file /home/marcos/Evidences/Windows10x64/Files/*
sha1sum /home/marcos/Evidences/Windows10x64/Files/*
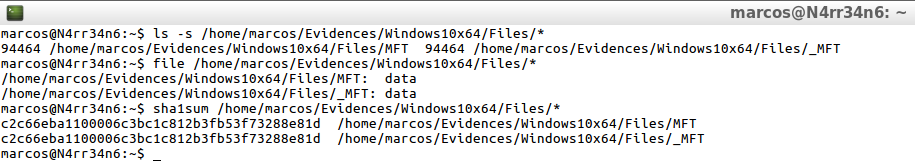
As it has been seen, the files are identical.
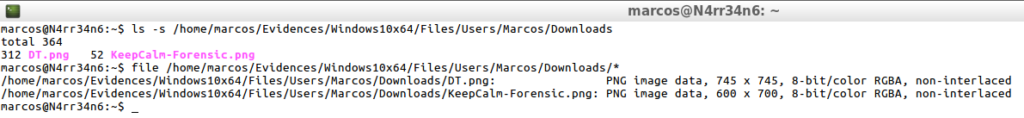
What else does this module allow me to do? Well, for example, extract several files at once. I just have to indicate their names, separated by commas.
image_export.py -o 1026048 --names 'KeepCalm-Forensic.png,DT.png' /home/marcos/Evidences/Windows10x64/ImagenDiscoWindows10x64 -w /home/marcos/Evidences/Windows10x64/Files

And I can verify that, indeed, a copy of those files has been extracted from the forensic image.
ls -s /home/marcos/Evidences/Windows10x64/Files/Users/Marcos/Downloads
file /home/marcos/Evidences/Windows10x64/Files/Users/Marcos/Downloads
I just realized that this ‘Plaso’ module extracts the files in a peculiar way. Respect the original directory and generate it within the output directory. In this way, I can always know what the location of those files was.
As you have seen, it is not necessary to mount the forensic image, neither to explore its content nor to extract data from its interior. Every day I am more reluctant to mount anything, because it is enough a minimum error in a single argument, or in a check box, to alter the evidence and leave the entire analysis process invalidated.
The main objective of this article was to show different ways of generating and visualizing timelines, using the CLI. I do not intend to speak here of its interpretation, which requires a separate chapter, of what I will speak in the future. Yes I can assure you that there are things that it is better not to believe, that should be seen by oneself.
That is all, for now. See you at the next post? This Minion, delivered and loyal to you, says goodbye… for now.
Marcos @_N4rr34n6_
Un comentario en «About the timelines: The limit, your imagination»
Thanks for sharing! I’ll try later.
Los comentarios están cerrados.