
Hi Minions:
Surely with the map on the cover, I’ve ‘gained‘ your attention 😀
We have not touched our beloved Windows for some time. I almost forgot what the mouse is for, and besides, not only of Linux environments live the Forensics 🙂
Today I want to talk about two tools.
The first of it is, ‘Sysmon‘, a small System utility, developed by Mark Russinovich and Thomas Garnier, free of charge, owned by Microsoft which, if it were up to me, would install it on all Systems that would pass through my hands.
This utility belongs to a group of other System tools, called SysInternals, a package of very useful and very interesting tools that should not be missing in our devices. Maybe I’ll tell you about some of them later.
«System Monitor (Sysmon) is a Windows system service and device driver that, once installed on a system, remains resident across system reboots to monitor and log system activity to the Windows event log. It provides detailed information about process creations, network connections, and changes to file creation time…«
That is, it will monitor all the activity that is carried out in the System where it is installed, (depending on its configuration), and it will be recorded to a system event file that we can later study. This file, located in ‘C:\Windows\System32\winevt\Logs‘, will be called ‘Microsoft-Windows-Sysmon% 4Operational.evtx‘.
«You can identify malicious or anomalous activity and understand how intruders and malware operate on your network.«
Let’s see it a bit in operation, to try to explain it better.
We go to their official website, in Microsoft, and proceed to download it.
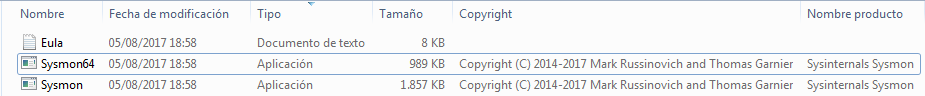
Once downloaded, we are presented with a compressed file in ‘.zip‘ format. We decompress them and extract these files.
And, what is the way of running it? Through the System console. So, the first thing we’re going to do is run the Command Prompt, ‘cmd‘.
Once we are in the console of the System Symbol, we go to the path where we have the executable and invoke its help, with the parameter ‘-h‘.
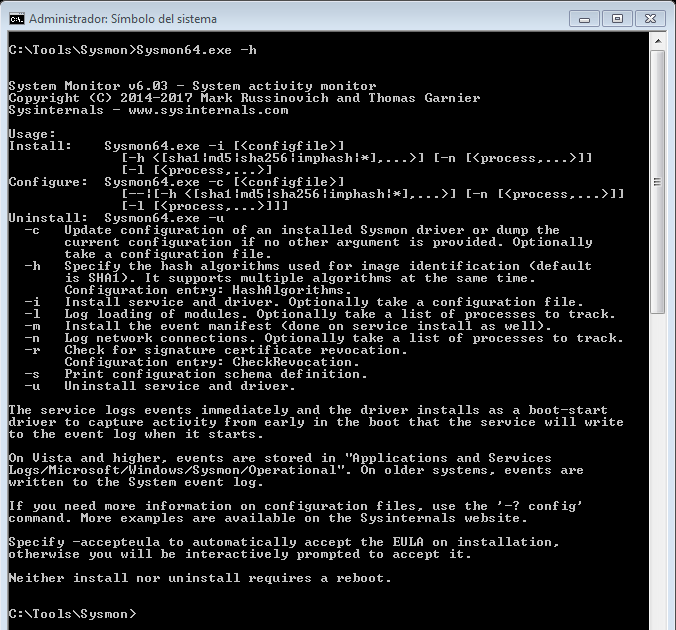
Its options are:
-c Update configuration of an installed Sysmon driver or dump the current configuration if no other argument is provided. Optionally take a configuration file.
-h Specify the hash algorithms used for image identification, (default is SHA1). It supports multiple algorithms at the same time. Configuration entry: HashAlgorithms.
-i Install service and driver. Optionally take a configuration file.
-l Log loading of modules. Optionally take a list of processes to track.
-m Install the event manifest, (done on service install as well).
-n Log network connections. Optionally take a list of processes to track.
-r Check for signature certificate revocation.
Configuration entry: CheckRevocation.
-s Print configuration schema definition.
-u Uninstall service and driver.
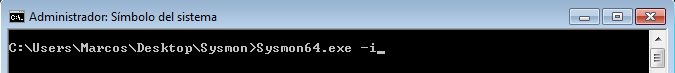
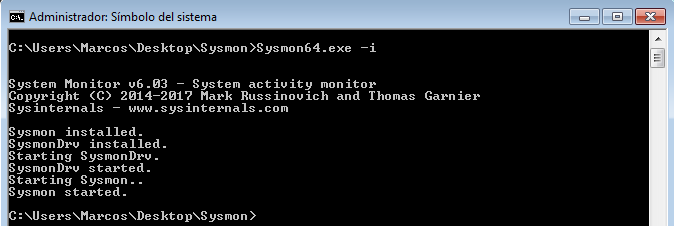
Its basic use, for the installation, is to call the utility and pass it the ‘-i‘ parameter.
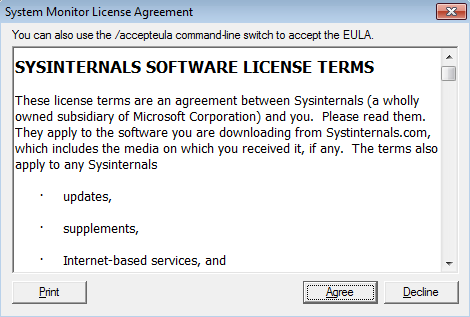
In this way the utility is installed in the System, where we will have to accept the terms of the license. We could skip this step of the license terms, using the parameter ‘-accepteula -i‘.
And once you have finished the installation it will notify what it has done, giving immediate start to the monitoring.
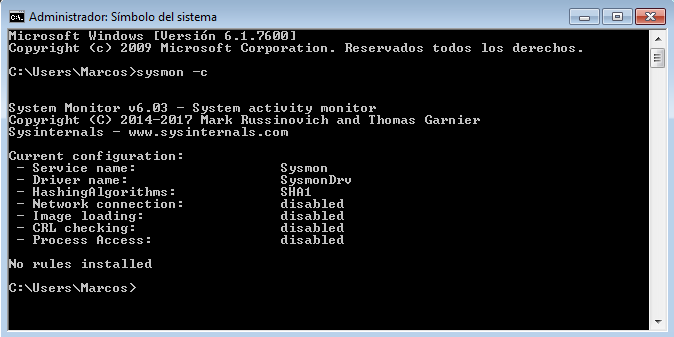
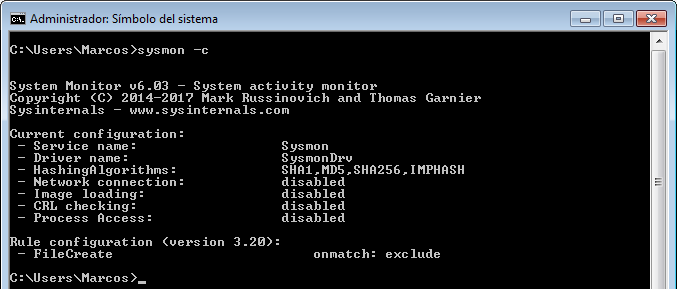
However, we have seen that there are multiple options for this utility. If we pass the parameter ‘-c‘, we can see what it is monitoring, and how. And it is important to know it because, for example, by default, it does not monitor Network connections.
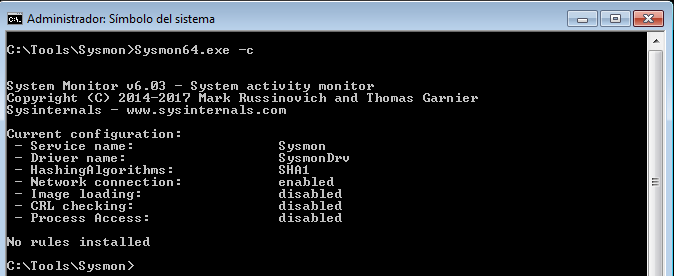
In order to monitor the network connections, we must pass the parameter ‘-n‘, (or indicate it in a configuration file of its own).

Now, if we pass again the parameter ‘-c‘, we can see how it tells us, in the ‘Network connection‘ section, that it is enabled.
Now, what kind of events are we going to monitor?
Event ID 1: Process creation
Event ID 2: A process changed to file creation time
Event ID 3: Network connection
Event ID 4: Sysmon service state changed
Event ID 5: Process terminated
Event ID 6: Driver loaded
Event ID 7: Image loaded
Event ID 8: CreateRemoteThread
Event ID 9: RawAccessRead
Event ID 10: ProcessAccess
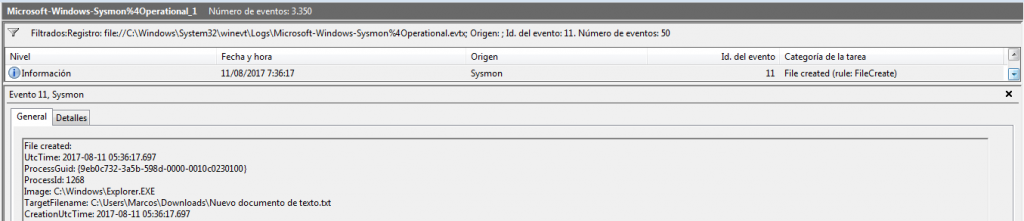
Event ID 11: FileCreate
Event ID 12: RegistryEvent (Object create and delete)
Event ID 13: RegistryEvent (Value Set)
Event ID 14: RegistryEvent (Key and Value Rename)
Event ID 15: FileCreateStreamHash
You have all this information well detailed in its official site.
We mentioned that this can work with a configuration file. Let’s see how. To do this, we pass the parameter ‘-? Config‘, to show the help of that configuration file.
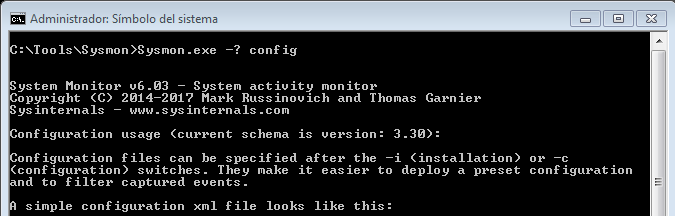
We can see that it can be specified after the installation and that it has to be in an ‘xml‘ format file.
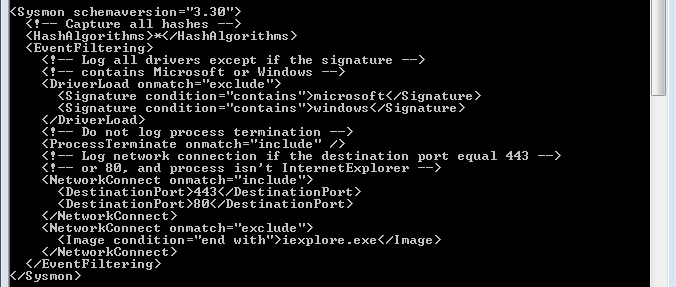
And, a little below, we can see its basic structure.
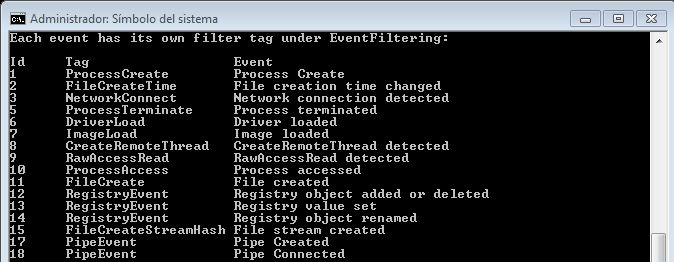
It also gives we information about what types of events you can filter.
1 ProcessCreate: Process Create
2 FileCreateTime: File creation time
3 NetworkConnect: Network connection detected
4 n/a Sysmon service state change (can not be filtered)
5 ProcessTerminate: Process terminated
6 DriverLoad: Driver Loaded
7 ImageLoad: Image loaded
8 CreateRemoteThread: CreateRemoteThread detected
9 RawAccessRead: RawAccessRead detected
10 ProcessAccess: Process Access
11 FileCreate: File created
12 RegistryEvent: Registry object added or deleted
13 RegistryEvent: Registry value set
14 RegistryEvent: Registry object renamed
15 FileCreateStreamHash: File stream created
16 n/a Sysmon configuration change (can not be filtered)
17 PipeEvent: Named pipe created
18 PipeEvent: Named pipe connected
With this information we can, for example, create our own configuration file, (we remember that it must be in ‘xml‘ format), so that, for example, we also monitor the creation of files, since, by default, it does not .
And the structure could look something like this:
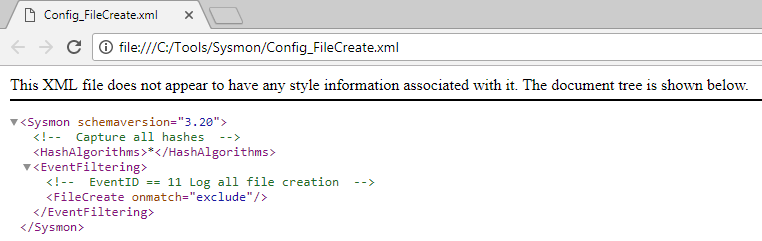
Once we have created it, we turn again to the command prompt to update the configuration of utility. This is done with the parameter ‘-c‘, indicating, next, the path where that configuration file is hosted. If there was some kind of error in its structure, it would tell it.
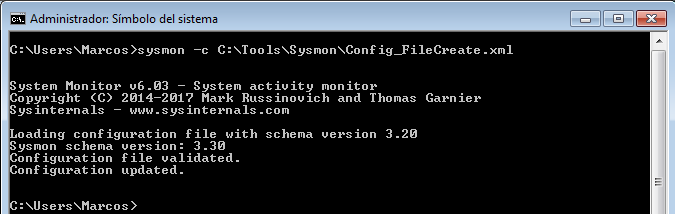
Once the configuration of the utility has been updated, and if we pass the parameter ‘-c‘, again, to we make sure what it is monitoring, it will show us the rules that we have included in that configuration file.
With this, we have installed more or less correctly, (this is a very basic use), this wonderful utility. But we face a big problem, called size. Because we must specify a size, (with a minimum value of 1024 kilobytes), suitable for the System in which it is installed. It can generate a lot of ‘noise’, (hence the importance of configuration). You have good information regarding the size of the events in this Microsoft site.
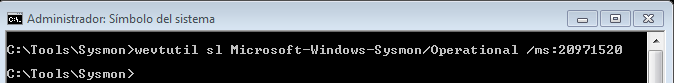
To specify the size of the event log, we will use the ‘wevtutil‘ utility, which is a command that is used through the System Symbol and allows, among other things, to install and uninstall event manifests, to execute queries and export , Archive and delete records.
The way to run it is ‘wevtutil sl Microsoft-Windows-Sysmon / Operational / ms: 20971520‘. In this case, I have assigned a maximum size of 20 MB.
And, now, yes, we have finished configuring this Sysmon event log, properly, and we can view it together with the rest of System events.
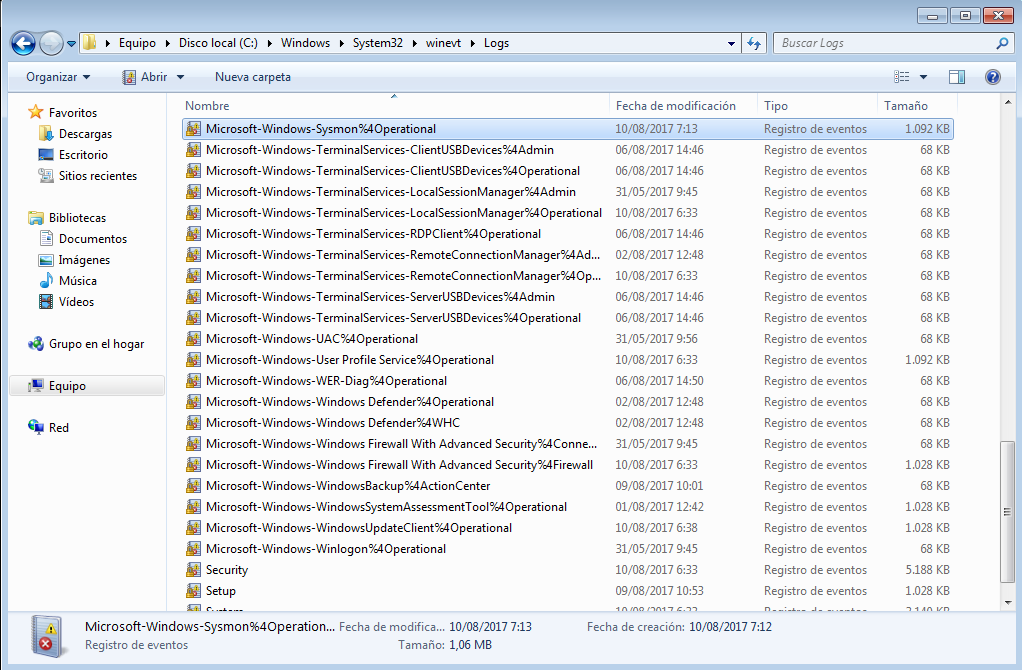
If we proceed to its opening, through the Windows event viewer itself, we can see how, from the moment of its installation, the monitoring of the System activity begins.
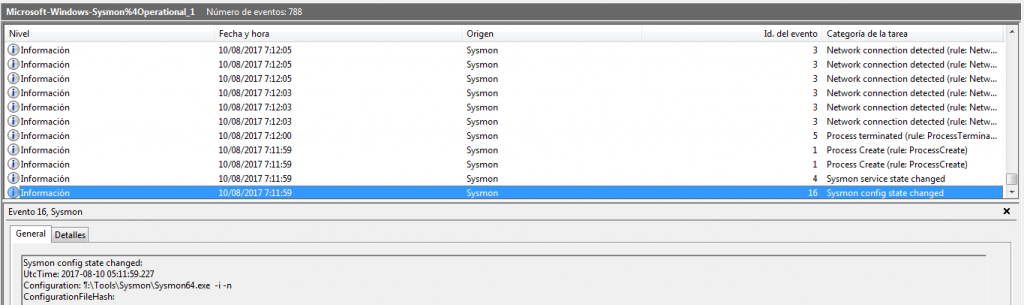
Conducting a study of this type of events can cause a real headache, given the activity it records. To help reduce that ‘inconvenience‘, the Windows Event Viewer provides a number of actions we can take.
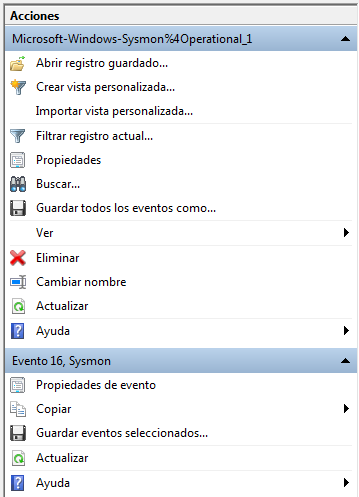
These actions include filtering events.
![]()
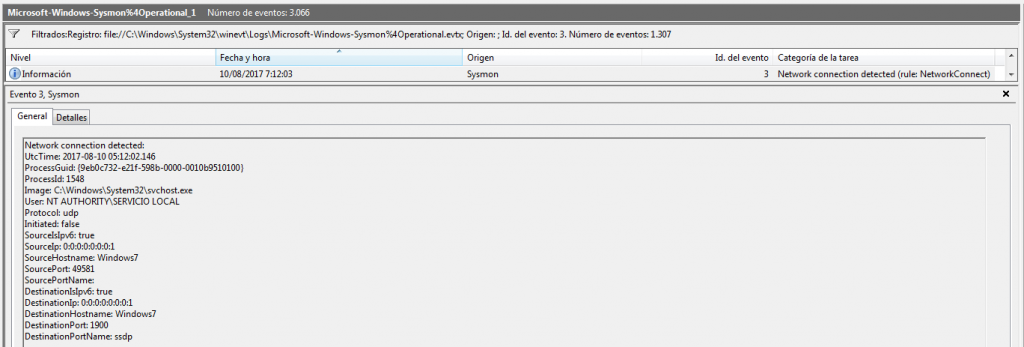
For example, by the Event ID.
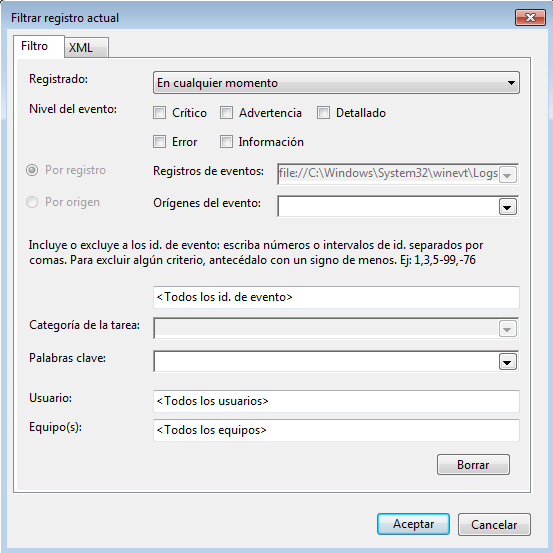
And that would only show us the events with that ID.
It offers us the possibility of searching for a word, or series of words, within the events.
![]()
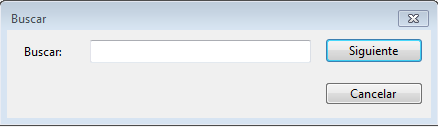
And it will show us the events that contain this word, or words.
And it also gives us the opportunity to save all events recorded in that file.
![]()
And this is what really interests me to show you right now.
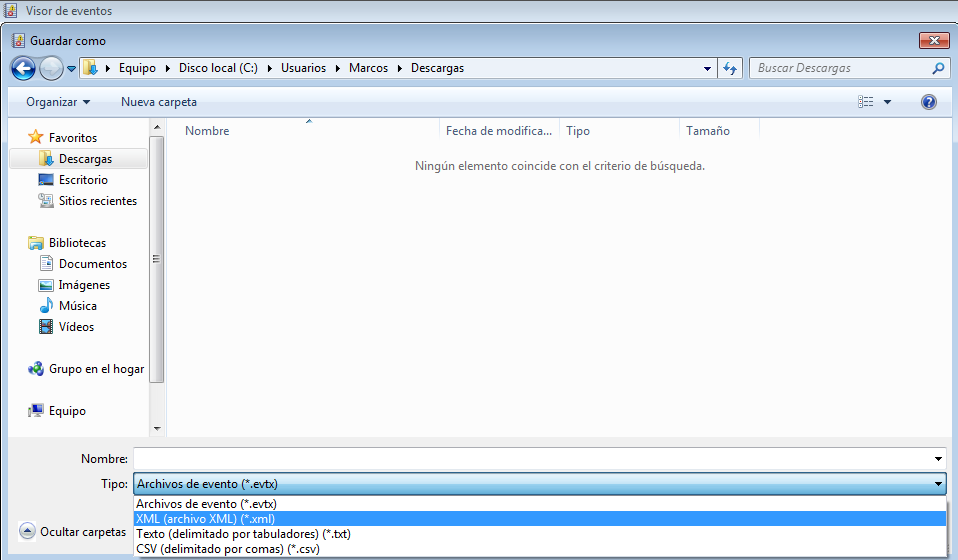
So, we are going to save all records, (which may be many or few, depends on the time and use of the System), in an ‘xml‘ format file.

And our beloved Windows will tell us that this file has been saved correctly. (Yes, I have disabled the antivirus of this VM 😉 ).

And now, we will open it, to be able to see, examine and try to understand, the structure of this file, which is this here.
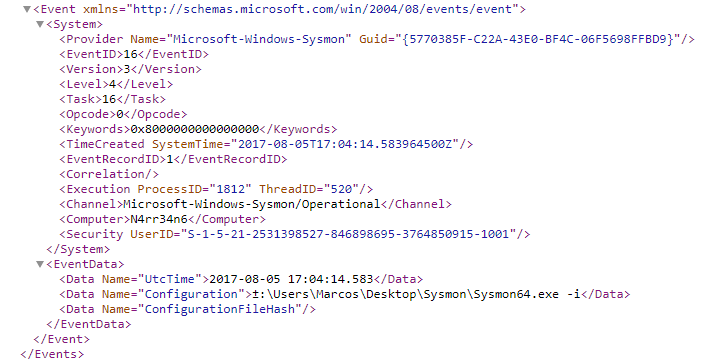
And, why am I interested in showing you the option of saving it to an ‘xml‘ file?
Because now I want to tell you about the second of the tools I want to present.
This is SysmonView, a new tool, free, developed by @nader_shalabi, which helps us in tracking and viewing Sysmon records. A very good visualization, I have to say, in a tree structure. And it has some very interesting functions.

Let’s see it in operation, with some examples.
First of all, we go to its official site in GitHub, to proceed to download it.
Once downloaded, and after decompressing it, we are presented with a single executable file.

No installation required, which means it is portable.
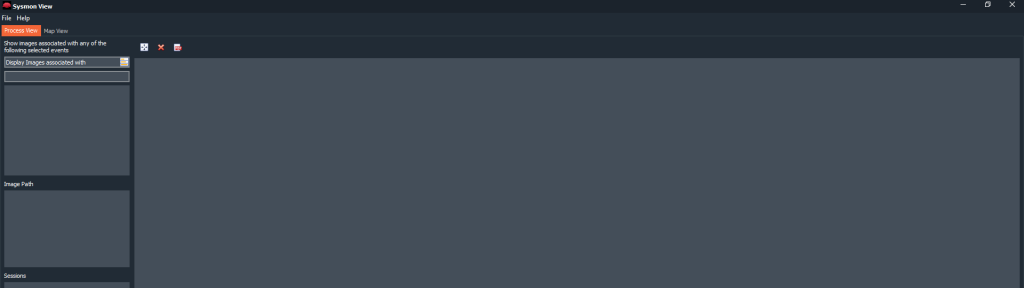
If we proceed to its execution, we will be shown this window. Its working interface.
Let’s import that file that we saved earlier with ‘XML‘ format.
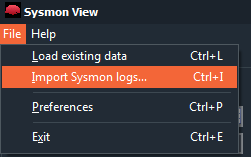
To do this, we go to ‘File > Import Sysmon logs…‘.
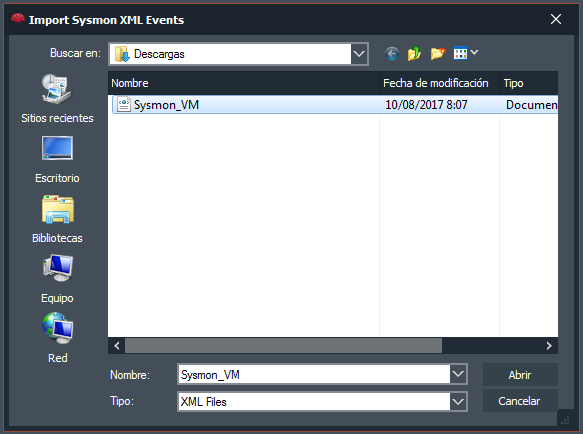
And we selected it.
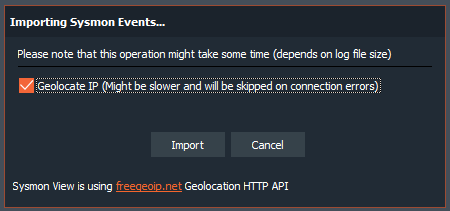
It will ask us if we want to geolocalize the Network connections that it finds, using, for this, the API of freegeoip.net. We tell to do so.
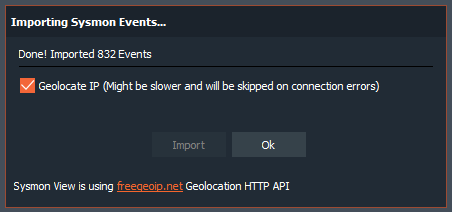
After a while, which may be greater or less, depending on the number of events and connections detected, it will tell us that it has finished correctly, indicating the number of events that it has imported.
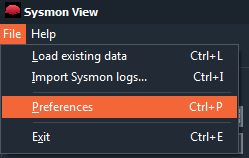
A very interesting option that has this tool is in ‘File > Preferences‘
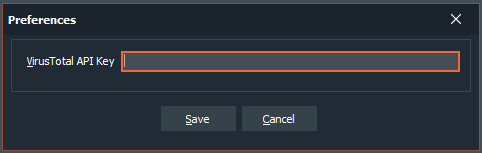
And it is the possibility of including our API of www.virustotal.com in this application, to analyze all the events with their search engines. Thus, we register on VirusTotal, if we have not already done so, and we acquire our ‘API Key‘.
I, personally, use Sysmon to know what makes a tool that i want to try, or when I propose to analyze any samples of malware.
I’m going to take, for example, the Sysmon file that I generated when I was studying the ‘USBOblivion‘ tool, (yes, the serie of «Be curious is not an option«).
And, once imported, I address, precisely, the process that calls to ‘clean‘ the events that it said it cleaned, ‘wevtutil‘.
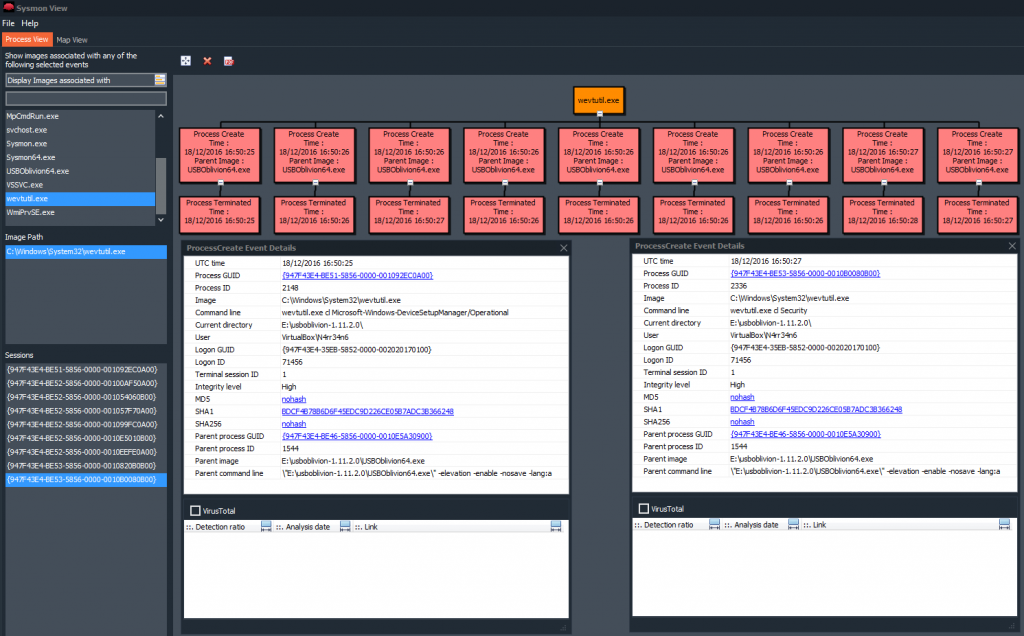
We can see in a very clear way, and in a graphic and tree structure, the processes, the image path and all generated sessions. Each and every one of the processes that are called by that utility, with their time stamps, their process identifiers, their routes, their directory, their hashes, parent process information, … All details of the event ‘Process Created‘. In this case in particular, we see, for example, how the utility ‘wevtutil‘, runs up to nine times in just three seconds, to try to clean the different event logs.
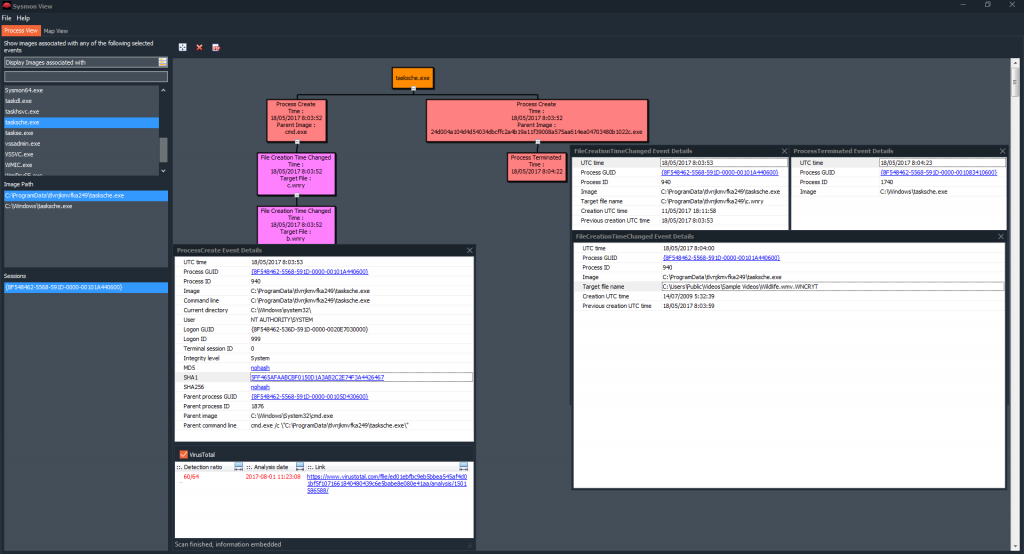
I’m going to take, now, another Sysmon event log that I generated, this time, when I was ‘playing‘, with WannaCry.
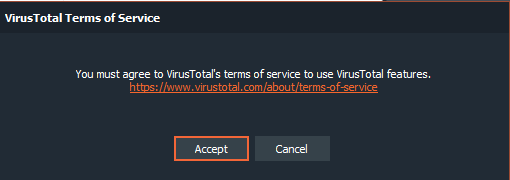
This time, after selecting a process and indicating, with two mouse clicks, to that it show me the details of the event ‘Process Created‘, I will validate the check box of VirusTotal.

It will tell us that we must accept the terms of service for your use. Thing that we do.
And after clicking the mouse in the hash that has been presented to us, we wait a few seconds for it to perform the scan and show us this nice information, with the number of detections, the date of the analysis and the URL so that we can see the Report that has been generated.
We can see all the events that have been mentioned previously. In this case, we are looking at the details of the events, ‘Process Created‘, ‘File Creation Time Changed‘ and ‘Process Terminated‘, with all the information that contains the properties of Windows events.
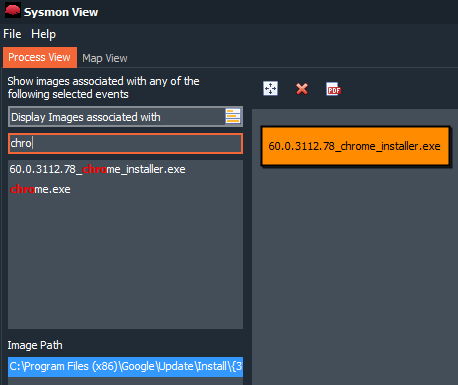
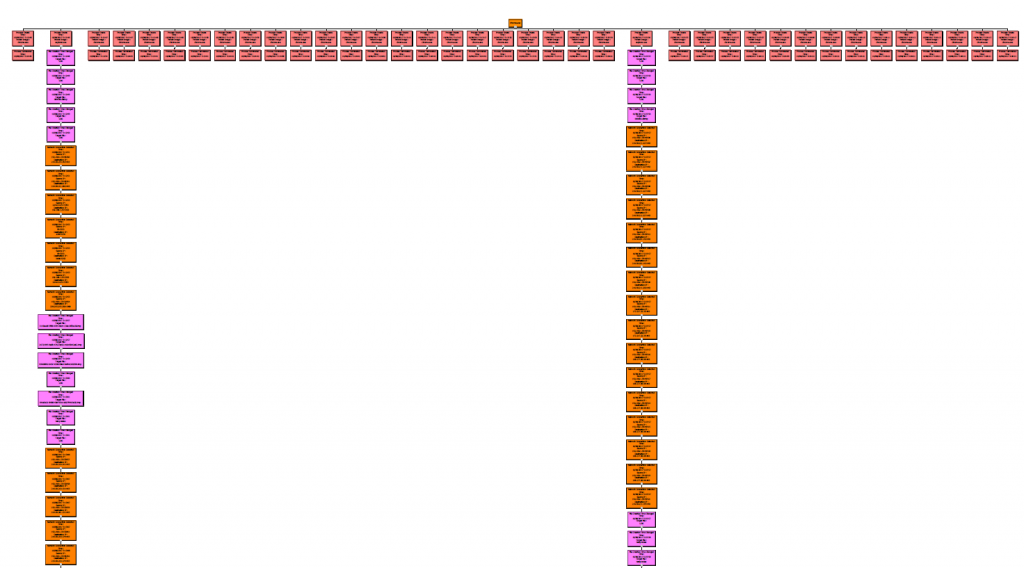
Now, I’m going to install it on a new system. Just install it, I downloaded the Chrome browser and I navigated through these internet addresses that ‘have come’ to my head.
![]()
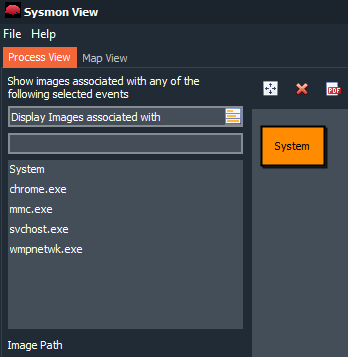
Another good option that presents this tool is the ability to search by words, or characters. So, for example, we know that, in this case, the Chrome browser installer has been run.
Another very interesting option that has this utility is to filter by type of event. We can tell it that we only want to be shown, for example, the event ‘Network connection detected‘.
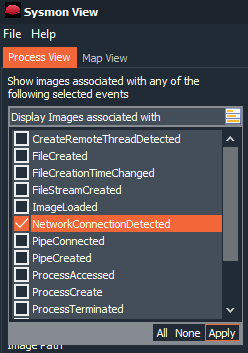
Once we give ‘Apply‘, it will only show us those events that have a network connection.
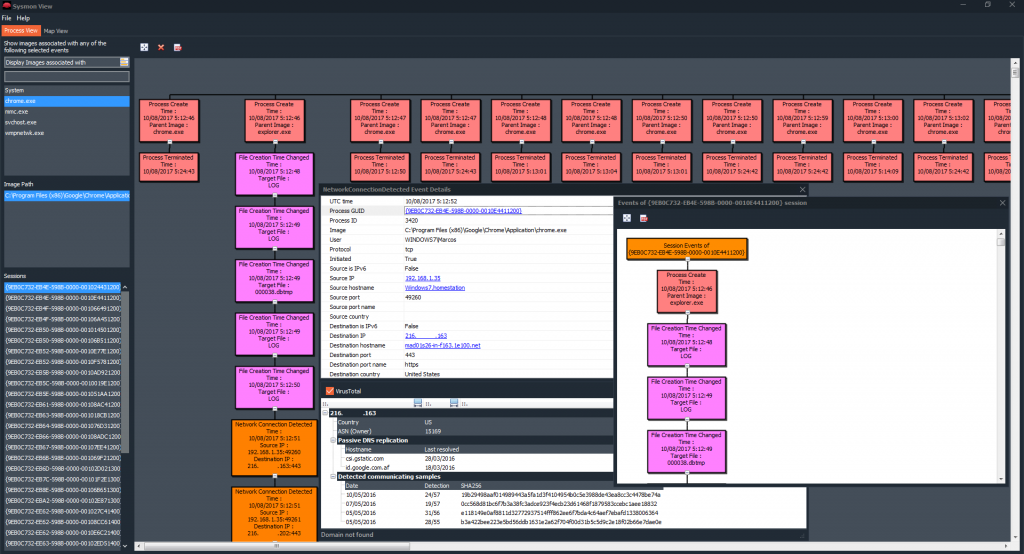
Thus, for example, we can see all the information related to the process ‘chrome.exe‘, all the events that this process has generated, including, IP addresses, ports, time stamps, geolocation, VirusTotal analysis, .. .
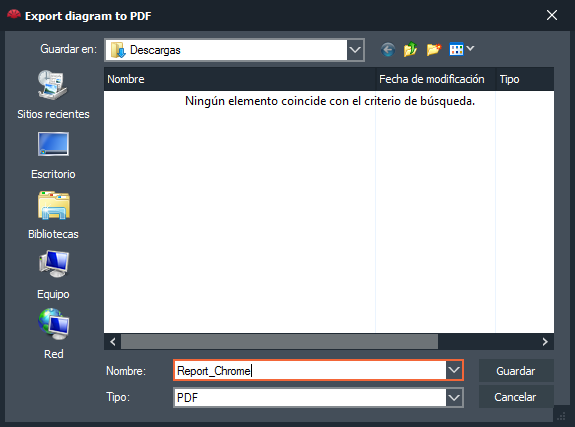
And there’s more. We can, if we click on the icon where it puts ‘PDF‘
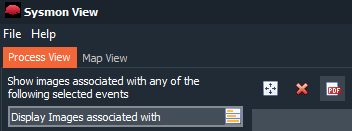
Export the results we have on the screen to a document in PDF format, which we can save, for a later study, for example.
And it would be presented this way. With the same details we have seen before.
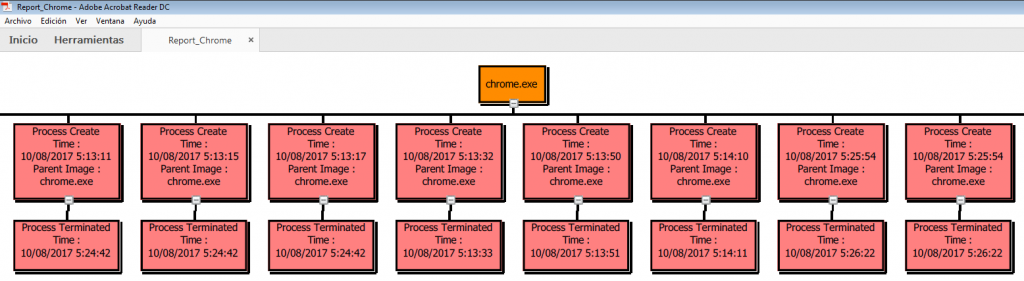
With all its structure and relation of events related to that process, (The ones you see are not all, and I only visited those few pages during this test).
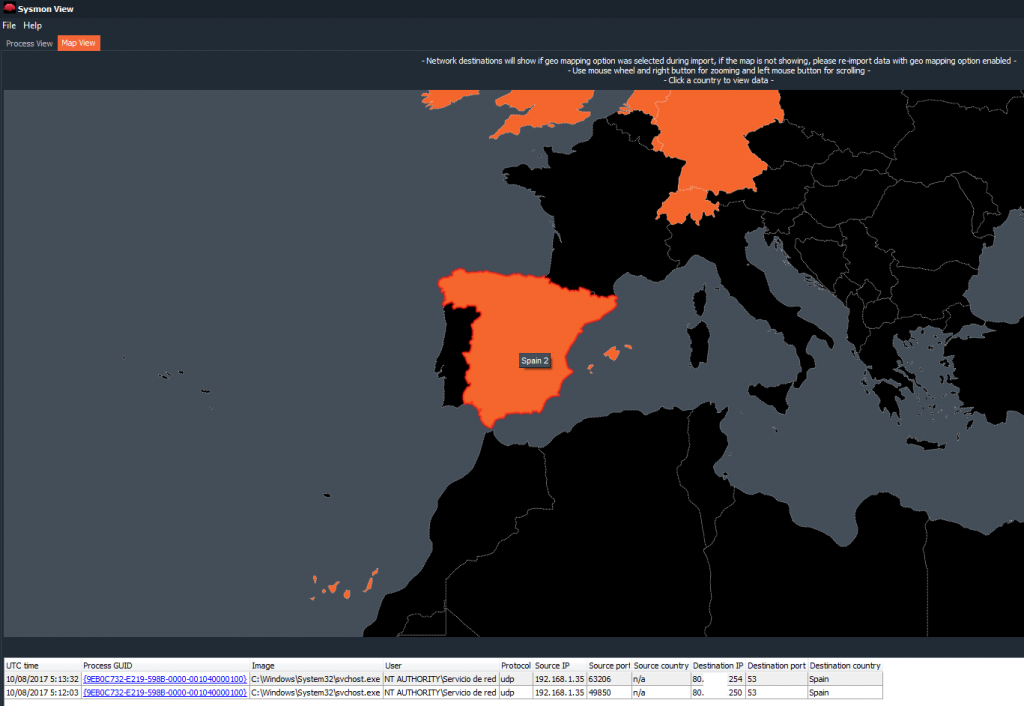
And, how could it be otherwise, where there is a geolocation, there is a map.
So yes. This magnificent tool allows, by clicking on its ‘Map View‘ option, graphically display the network information that has been registered.
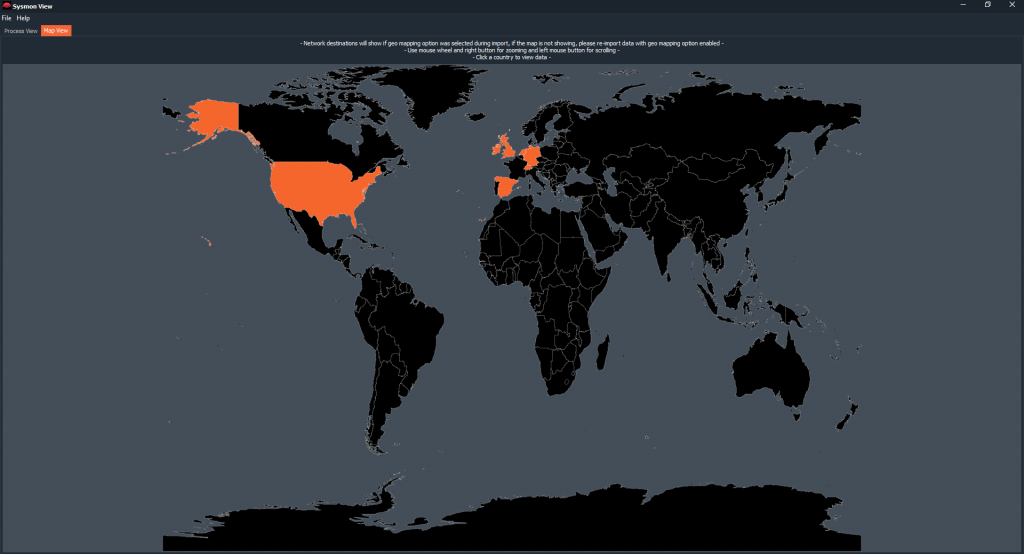
And it allows interaction, clicking countries, zooming, … And also it will show us the information of Network that has relation with the country that we choose, with the marks of time, the process, the origin and destination IP addresses, the ports Origin and destination, and the country.
I invite you to try this event analysis tool. I find it very useful, very interesting and very helpful. It facilitates much the research, (and does not produce as many headaches as others 😉 ).
On the other hand, as far as Windows events are concerned, I came across this Technical Guide for Windows Event Logging (PDF), from the Australian Cybersecurity Center. I recommend it to you.
That is all, for now. See you at the next entry. This Minion, delivered and loyal to you, says goodbye… for now.
Marcos @_N4rr34n6_